

Technically Speaking
Gold and the Election

Historically, gold has been THE market investors turn to in times of global uncertainty. This means gold is viewed as a safe-haven market, one of the view so anointed and dating back as long as goods have been traded. This year's U.S. presidential, complete with endless campaign bitterness and little talk of policy, has created nothing but uncertainty making gold shine more brightly than usual in the international investment spotlight.
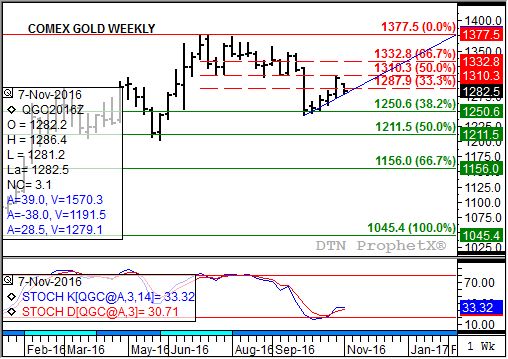
All this makes the ongoing downtrend on its continuous weekly chart that much more interesting. Note that after a period of consolidation following its high of $1,377.50 (week of July 5, 2016), gold futures finally established a downtrend with a move below $1,310.70 (week of August 29). The more active contract eventually gained downside momentum (note the move by weekly stochastics, bottom chart) as the more active futures contract tested support at $1,250.60 (weeks of October 3 through October 17).
P[L1] D[0x0] M[300x250] OOP[F] ADUNIT[] T[]
From that series of lows gold posted an upswing, recovering 50% of its initial sell-off from the July high through the October low of $1,243.20. The pattern created on its weekly chart looks to be a bearish flag, meaning the market's secondary (intermediate-term) downtrend was only half over. On cue, after testing resistance at $1,310.30 (week of October 31) Dec gold has turned down again this week and is threatening to break through trendline support at $1,279.10 (blue line).
Let's say Dec gold confirms its bearish flag with a move below short-term trendline support, what then? Classic flagpole measuring shows us the length of the first move to be $67.50 ($1,310.70 - $1,243.20). Therefore, if Dec gold were to move below $1,279.10, and the same range is subtracted for the second-half of the flagpole, the target becomes $1,211.60 ($1,279.10 - $67.50). Interestingly enough, that would be a near exact test of the 50% retracement level of the previous secondary uptrend from $1,045.40 through the July 2016 high.
This Wave 3 of a three-wave (Elliott) downtrend would not only result in a 50% retracement, but would likely pull weekly stochastics below the oversold level of 20%, setting the stage for an eventual bullish crossover. In other words, an initial move back to the next secondary uptrend.
Lastly, remember the basic tenet of technical analysis: "Anything that can possibly affect the market price of a commodity futures contract - fundamental, political, psychological, or otherwise - is actually reflected in the price of that commodity. It follows, therefore, that a study of price action is all that is required." (From John J. Murphy's oft quoted "Technical Analysis of the Futures Markets", page 2.)
If we, as market technicians, believe that then what can we say about the soon to be over political fight for the most important job in the world? Does the ebb and flow of the gold market lead, follow, or skip along hand in hand with the ever-changing polls over the last year? We should know more by the end of the day.
Don't forget to follow Election Day coverage on DTN from early Tuesday through the release of USDA reports Wednesday.
To track my thoughts on the markets throughout the day, follow me on Twitter: www.twitter.com\DarinNewsom
Comments
To comment, please Log In or Join our Community .