

Technically Speaking
Talking the USDX Up
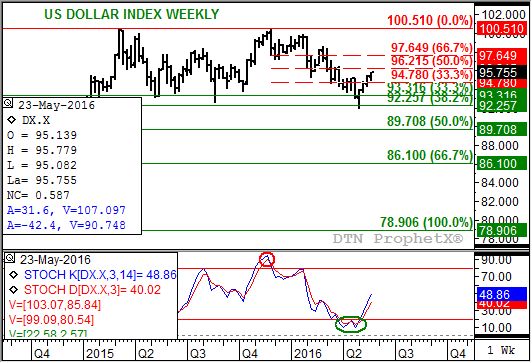
The weekly chart for the U.S. dollar index (USDX) shows it established a secondary (intermediate-term) uptrend with the close the week of May 2. Note the spike reversal that occurred that week, after the USDX moved to a new low for the previous downtrend of 91.919 before rallying to close at 93.888. This also led to a bullish crossover by weekly stochastics below the oversold level of 20%, confirming a similar pattern from the week of April 18.
Since early May the USDX has extended its rally, first through resistance at 94.780 to this week's test of next resistance at 96.215. These prices mark the 33% and 50% retracement levels of the previous downtrend from the 100.510 high through the 91.919 low. Given that weekly stochastics continue to grow more bullish, the USDX is likely to move toward a test of the 67% retracement level of 97.649.
Fundamentally the greenback has been driven higher by ideas a June Federal Reserve interest rate increase is becoming more likely (for a great discussion on this topic, see DTN Editor Emeritus Urban Lehner's blog "Markets Ride the Federal Reserve Roller Coaster"). It should also be noted that market activity during May has the USDX in position to establish a bullish outside range on its monthly chart as well. I'll be talking about the long-term implications of this in a later post.
To track my thoughts on the markets throughout the day, follow me on Twitter:www.twitter.com\Darin Newsom
P[L1] D[0x0] M[300x250] OOP[F] ADUNIT[] T[]

Comments
To comment, please Log In or Join our Community .