
Technically Speaking
Weekly Analysis: Grain Markets
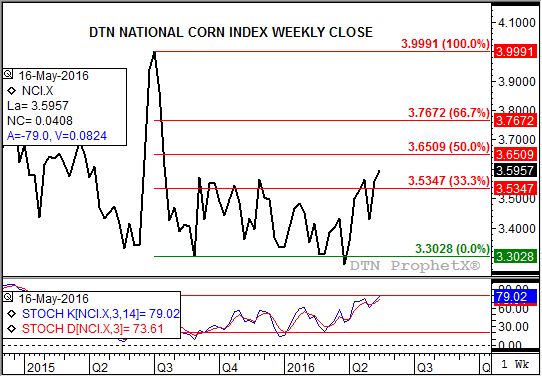
Corn (Cash): The DTN National Corn Index (NCI.X, national average cash price) closed at $3.59 1/2, up 3 3/4 for the week. The secondary (intermediate-term) trend is up with the clearest picture of the trend on the weekly close chart. Weekly stochastics remain bullish but nearing the overbought level of 80%. Next resistance on the weekly close chart is $3.65, the 50% retracement level of the previous secondary downtrend from $4.00 through the low of $3.30 1/4.
Corn (Old-crop futures): The July contract closed 3.75cts higher at $3.94 1/2. Corn remains a difficult call, in regards to trend, with a number of different signals being shown. The continuous weekly close chart indicates the secondary (intermediate-term) trend is up, but unable to get through resistance at the major (long-term) downtrend line calculated at $3.96 1/2 last week. On the other hand, the market's continuous monthly chart shows a bullish reversal last month indicating the major trend is up. July corn's weekly chart shows a sideways-to-up secondary trend with initial resistance pegged at $4.11 1/4. The recent high has been $4.07 1/4 the week of April 18.
Corn (New-crop futures): The December 2016 contract closed 1 1/2 cents higher at $3.99 3/4. The secondary (intermediate-term) trend remains sideways-to-up with initial resistance near $4.13. This price marks the 23.6% retracement level of the previous downtrend through the contract low of $3.64. The contract is also below its recent highs of $4.06 3/4 (last week) and $4.09 (week of April 18).
Soybeans (Cash): The DTN National Soybean Index (NSI.X, national average cash price) closed at $10.03 3/4, up 11 1/4 cents for the week. The secondary (intermediate-term) trend remains up, in line with the market's major (long-term) trend. However, weekly stochastics are well above the overbought level of 80% indicating the market could come under renewed pressure. Also, while the market's weekly close only chart shows a settlement above resistance at $9.99 1/2, confirmation of a bullish breakout will need to be seen this week. A similar spike lower was seen on the downside with a close below support at $8.10 1/2 the week of February 22, 2016, but a lack of bearish confirmation led to the current secondary uptrend.
P[L1] D[0x0] M[300x250] OOP[F] ADUNIT[] T[]
Soybeans (Old-crop futures): The July contract closed at $10.74 1/4, up 9 1/4 cents for the week. The secondary (intermediate-term) trend remains up, in line with the market's major (long-term) trend. However the contract was unable to move beyond the previous week's high of $10.91 1/2, and with weekly stochastics above 90% increased selling interest could emerge. If so initial support is last week's low of $10.51, then the 33% retracement level of the uptrend at $10.14 1/4. If the contract pulls back that far it would likely have established a secondary downtrend.
Soybeans (New-crop futures): The November 2016 contract closed at $10.49 1/2, down 5 cents for the week. The contract looks to have moved into a secondary (intermediate-term) downtrend following a bearish crossover by weekly stochastics. Initial support is at $10.03 1/4, the 33% retracement level of the previous uptrend from $8.50 through the recent high of $10.79 3/4. Note that this high came up just short of resistance pegged at $10.90 3/4. A bullish new-crop forward curve could limit the pullback to the 33% to 50% retracement range, the latter down near $9.64 3/4.
SRW Wheat (Cash): The DTN SRW Wheat National Index (SR.X, national average cash price) closed at $4.21 1/2, down 6 3/4 cents for the week. The secondary (intermediate-term) trend remains sideways in a wide range between its major low of $4.02 1/4 and the recent high of $4.63. The latter was a test of resistance between $4.54 1/2 and $4.75 3/4, prices that mark the 23.6% and 33% retracement levels of the previous downtrend from $6.23 through the major low.
SRW Wheat (New-crop futures): The July 2016 Chicago contract closed at $4.67 3/4, down 7 cents for the week. The secondary (intermediate-term) trend remains sideways with support at the contract low of $4.49 1/2.
HRW Wheat (Cash): The DTN HRW Wheat National Index (HW.X, national average cash price) closed at $3.79 1/2, down 6 1/4 cents for the week. The secondary (intermediate-term) trend is down after cash HRW posted a new low weekly close last week. Major (long-term) support is near $3.41 1/2, the monthly low from June 2010.
HRW Wheat (New-crop futures): The July 2016 Kansas City contract closed at $4.49, down 7 cents for the week. The contract was able to hold above its recently established low of $4.41 1/4. While no bullish turn signals have been seen, in regards to the secondary (intermediate-term) trend, weekly stochastics are nearing a bullish crossover below the oversold level of 20%.
HRS Wheat (Cash): The DTN HRS Wheat National Index (SW.X, national average cash price) closed at $4.71 1/4, down 8 cents for the week. The secondary (intermediate-term) trend remains sideways, though last week's close at the weekly low could lead to renewed selling interest this week.
HRS Wheat (New-crop futures): The September 2016 Minneapolis contract closed at $5.35 1/4, down 7 cents for the week. Despite the lower weekly close the secondary (intermediate-term) trend remains up. The minor (short-term) downtrend on the daily chart is nearing an end as the contract tests support near $5.34 3/4. This price marks the 50% retracement level of the previous minor uptrend from $5.02 3/4 through the high of $5.67.
To track my thoughts on the markets throughout the day, follow me on Twitter: www.twitter.com\DarinNewsom

Comments
To comment, please Log In or Join our Community .