Technically Speaking
Gold Bugs Biting Commodity Bears
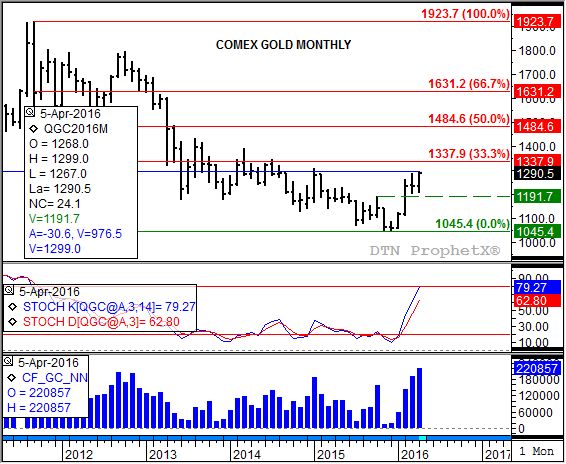
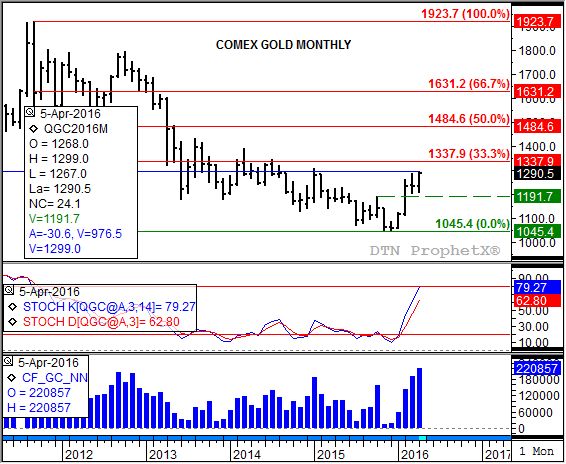
Gold bugs (traders bullish the gold market) flexed their muscle as April came to an end, pushing the most active June futures contract to its highest level since January 2015. Those tracking the market through this blog and my weekly On the Market column on DTN shouldn't be surprised given the market turned a bullish corner at the end of this past January. As the attached monthly chart shows, gold's major (long-term) uptrend continues to strengthen. Let's take a look at some of the key components.
P[L1] D[0x0] M[300x250] OOP[F] ADUNIT[] T[]
First, as mentioned above, June gold moved to a new 12-month high on Friday, April 29, buzzing past the March 2016 peak of $1,287.80. Support for gold continues to come from increased investment buying due in large part to the strengthening downtrend in the U.S. dollar index (for more information, see the Technically Speaking blog post for Monday, May 2). CFTC's Commitments of Traders report at the end of April showed noncommercial traders increasing their net-long futures position to 220,857 contract (bottom study, blue histogram) from late March's 189,806 contracts.
Second, bullish momentum should continue to build as monthly stochastics (middle study) finished April still below the overbought level of 80%. The question is: How high can gold go on this move? Note that the first target is $1,337.90, a price that marks the 33% retracement level of the previous major downtrend from $1,923.70 (September 2011) through the low of $1,045.40 (December 2015). Beyond that is the 50% retracement level of $1,484.60.
Of these two targets, a test of the first could be enough to pull monthly stochastics above the overbought 80% mark. How do we know this? Go back on the chart a bit and look at the range between the October 2015 high of $1,191.70 (green dashed line) and the December 2015 low of $1,045.40. This gave us a range of $137.30 as the market consolidated, nearing the end of its previous major downtrend. February 2016 saw gold break out of this consolidation pattern, allowing us to establish a possible target by adding the range ($137.30) to the bullish breakout point ($1,191.70). Doing so puts the initial target at $1,329.00, close enough to the 33% retracement level to call it a fit.
If gold reaches this target and starts to fall back, it won't be the end of the world for commodities. The big picture is gold, one of the sector's key markets, is in the early stages of a 5-Wave uptrend (Elliott Theory), with an eventual 50% to 67% retracement of the previous downtrend not out of the question.
To track my thoughts on the markets throughout the day, follow me on Twitter:www.twitter.com\Darin Newsom


Comments
To comment, please Log In or Join our Community .