Technically Speaking
Gold's Leap of Faith
This is one of those blog posts I've started a half-dozen times, only to move it to the backburner waiting to see what would happen next. But with the extra day of February now under way, it's time to take the leap of faith and proclaim: Yes, gold is indeed in a major (long-term) uptrend.
Did you get the same cold chill running down your spine as I when you read that? How in the world can gold be in an uptrend with the U.S. dollar index continuing to faithfully follow Rule 4 of market analysis (A market that cant' go down, won't go down.)? But as John Lennon once said, these are "strange days indeed".
P[L1] D[0x0] M[300x250] OOP[F] ADUNIT[] T[]
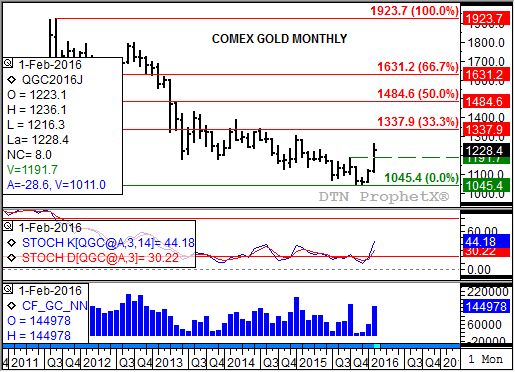
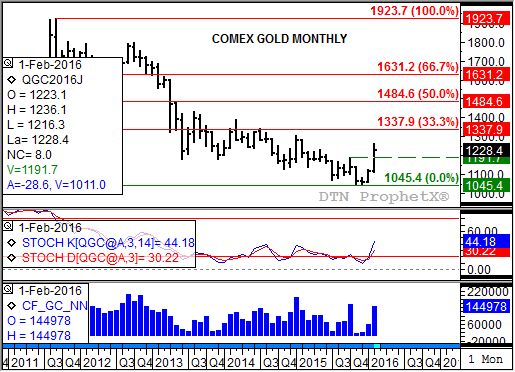
Take a look at the attached continuous monthly chart for Comex gold (most active contract). Note the rally in February has seen the April contract rocket past the previous high of $1,191.70 posted back in October 2015 (dashed green line). Also note that monthly stochastics (middle study) established a bullish crossover at the end of January (for further discussion go back to my blog post from January 29, "Gold Bulls Have a Weekend to Dream") hinting at the end of the previous major downtrend and increased buying interest to come.
Bullish momentum did increase. Based on weekly CFTC Commitments of Traders data (bottom study, blue histogram), noncommercial interests increased their net-long futures position by almost 86,000 to a total of 144,978 contracts (as of Tuesday, February 23).
So, with noncommercial buying interest growing and a major uptrend now in place, what's next for gold? The initial upside target is $1,337.90, a price that marks the 33% retracement level of the previous downtrend from $1,923.70 through the December 2015 low of $1,045.40. An interesting sidenote: If you take the $146.30 range from the October 2015 high through the December 2015 low ($1,191.70 - $1,045.40) and add it to the breakout point of the October high, the target becomes $1,338.00 ($1,191.70 + $146.30), in line with the 33% retracement level.
In the big picture this would just be a possible Wave 1 of a 5-Wave (Elliott Theory) uptrend in gold. Eventually the market could see a 50% retracement up to $1,484.60, or a 67% move back to $1,631.20. If so does that mean the U.S. dollar index will eventually, finally, find a reason to move lower? And if that happens, what will be seen on the long-term charts of the other kings of commodities, crude oil and corn?
on the markets throughout the day, follow me on Twitter:www.twitter.com\Darin Newsom


Comments
To comment, please Log In or Join our Community .