

Technically Speaking
Monthly Analysis: Grain Markets
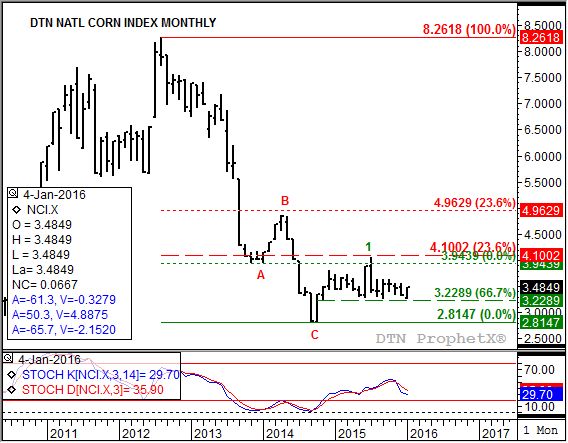
Corn (Cash): The DTN National Corn Index (NCI.X, national average cash price) closed at $3.48 1/2, up 14 3/4 cents for the month. Technically the NCI.X remains in a 5-Wave uptrend (Elliott) dating back to the Wave C low near $2.81 1/2 back in October 2014. However, much of the time since has seen cash corn move sideways between support at roughly $3.23 and resistance at the December 2014 high of $2.80. Initial resistance is at the August 2015 peak of $3.64 1/2. Monthly stochastics are neutral with the last major signal a bullish crossover below the oversold level of 20% in conjunction with the October 2014 low. The weekly chart shows the secondary (intermediate-term) trend has turned up with the NCI.X posting a new 4-week high last Friday. Initial resistance on the weekly chart is between $3.49 1/2 and $3.59 1/2.
Corn (Futures): The March contract closed at $3.72, up 13 1/4 cents on the monthly chart. Similar to the cash market, corn futures remain in a major (long-term) 5-Wave uptrend (Elliott) on the monthly chart. However, as seen in the NCI.X, nearby futures have had difficulty breaking out of a sideways pattern with support near $3.50 1/4 and initial resistance at the October 2015 high of $3.99 3/4. Monthly stochastics are neutral, with the last major signal a bullish crossover below the oversold level of 20% in conjunction with the October 2014 low. Noncommercial traders continue to hold a net-short futures position, with possible short-covering in February providing support.
P[L1] D[0x0] M[300x250] OOP[F] ADUNIT[] T[]
Soybeans (Cash): The DTN National Soybean Index (NSI.X, national average cash price) closed at $8.35 1/2, up 16 3/4 cents for the month. The major (long-term) trend is sideways with support at the previous low of $8.0857 (September 2015). However, the rally late in the month led to a bullish crossover by monthly stochastics below the oversold level of 20%, signaling increasingly bullish momentum. However, the close near the monthly high of $8.38 1/4 opens the door for a potential breakaway bullish gap if the market continues its rally into February.
Soybeans (Futures): The March contract closed at $8.82 1/4, up 18.00 cents on the monthly chart. The major (long-term) trend remains sideways with support at the low of $8.44 1/4 (November 2015). However, monthly stochastics established a bullish crossover below the oversold level of 20%, setting the stage for increased upside momentum. This could come from continued noncommercial short-covering, with this group continuing to hold a net-short futures position of 40,504 contracts late in January.
Wheat (Cash): The DTN National SRW Wheat Index (SR.X, national average cash price) closed at $4.37 1/4, up 12 cents for the month. The major (long-term) trend remains sideways, though the SR.X was able to close near its monthly high of $4.43. The sideways range is bounded by the September 2015 low of $4.19 3/4 and the November 2015 high of $4.77 1/2. Monthly stochastics are nearing a bullish crossover below the oversold level of 20%.
SRW Wheat (Futures): The March Chicago contract closed at $4.79 1/4, up 9.25 cents on the monthly chart. After posting a new low of $4.56 during January the March contract was able to rally late in the month. This sets the stage for January's move to later be viewed as a bullish spike reversal, though no bullish crossover was seen by monthly stochastics. The latter is close, and could be seen if buying interest continues in February. The most likely support could come from noncommercial short-covering with this group holding a net-short futures position of 55,743 contracts in late January.
To track my thoughts on the markets throughout the day, follow me on Twitter: www.twitter.com\DarinNewsom

Comments
To comment, please Log In or Join our Community .