

Technically Speaking
Monthly Analysis: Livestock Markets
Live Cattle: The April contract closed at $134.00, down $2.80 on the monthly chart. The market remains a mix of technical signals. However, its major (long-term) trend may best be described as sideways in the wide range between resistance near $138.90 and support near $126.50. Monthly stochastics still have not established a bullish crossover below the oversold level of 20%, possibly indicating another round of pressure could be seen.
P[L1] D[0x0] M[300x250] OOP[F] ADUNIT[] T[]
Feeder Cattle: The March contract closed at $157.25, down $6.40 on the monthly chart. The market continues to indicate it has moved into a 5-Wave uptrend (Elliott), though Wave 1 may have already run into resistance near $165.15. This price marks the 23.6% retracement level of the previous downtrend from $245.75 through the December low of $143.20. The January high was $166.875 before the market fell back.
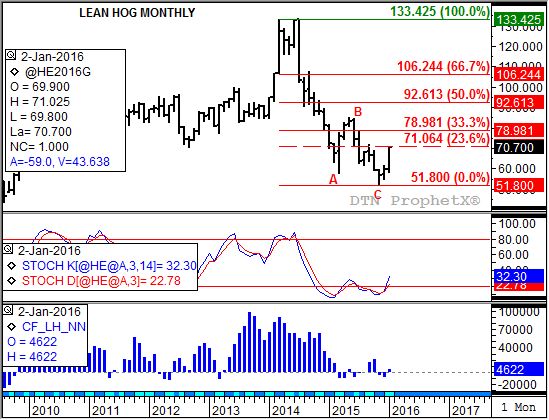
Lean Hogs: The April contract closed at $70.70, up $10.90 on the monthly chart. The major (long-term) trend remains up as the market remains in Wave 1 of a newly established 5-Wave (Elliott) move. However, the April contract is already testing resistance near $71.05, the 23.6% retracement level of the previous downtrend from $133.425 through the November 2015 low of $51.80. Characteristically, Wave 1 is usually the shortest of the five waves. Monthly stochastics remain bullish above the oversold level of 20%.
Corn (Cash): The DTN National Corn Index (NCI.X, national average cash price) closed at $3.48 1/2, up 14 3/4 cents for the month. Technically the NCI.X remains in a 5-Wave uptrend (Elliott) dating back to the Wave C low near $2.81 1/2 back in October 2014. However, much of the time since has seen cash corn move sideways between support at roughly $3.23 and resistance at the December 2014 high of $2.80. Initial resistance is at the August 2015 peak of $3.64 1/2. Monthly stochastics are neutral with the last major signal a bullish crossover below the oversold level of 20% in conjunction with the October 2014 low. The weekly chart shows the secondary (intermediate-term) trend has turned up with the NCI.X posting a new 4-week high last Friday. Initial resistance on the weekly chart is between $3.49 1/2 and $3.59 1/2.
Soybean meal: The March contract closed at $272.40, up $6.90 on the continuous monthly chart. The market posted a new long-term low of $263.80, its lowest price since July 2010, in January before rallying late in the month. Despite the rally, no bullish technical signal was established leaving the major (long-term) trend down for now. However, monthly stochastics are nearing a bullish crossover below the oversold level of 20%.
To track my thoughts on the markets throughout the day, follow me on Twitter: www.twitter.com\DarinNewsom


Comments
To comment, please Log In or Join our Community .