

Technically Speaking
Monthly Analysis: Livestock Markets
Live Cattle: The February contract closed at $136.80, up $4.45 on the monthly chart. The market is showing conflicting signals on its long-term monthly chart. The Feb futures contract looks to have established a bullish spike reversal after posting a low of $121.975 before rallying to a monthly high of $137.875. However, the most recent bullish crossover by stochastics is above the oversold level of 20%, indicating another test of support near $126.50 is possible. Initial resistance is near $138.90, the 33% retracement level of the previous major sell-off. The 50% retracement level is up near $147.35.
P[L1] D[0x0] M[300x250] OOP[F] ADUNIT[] T[]
Feeder Cattle: The March contract closed at $163.65, up $0.90 on the monthly chart. The market looks to have ended its three-wave downtrend (Elliott Wave) with December's low of $143.20 representing Wave C. This was a test of support between $146.70 and $138.80, prices that mark the 61.8% and 67% retracement levels of the previous major (long-term) 5-Wave uptrend from the low of $85.40 (December 2008) through the high of $245.75 (October 2014). Wave 1 of the newly established uptrend could result in a test of resistance near $174.15, the 33% retracement level of the previous downtrend.
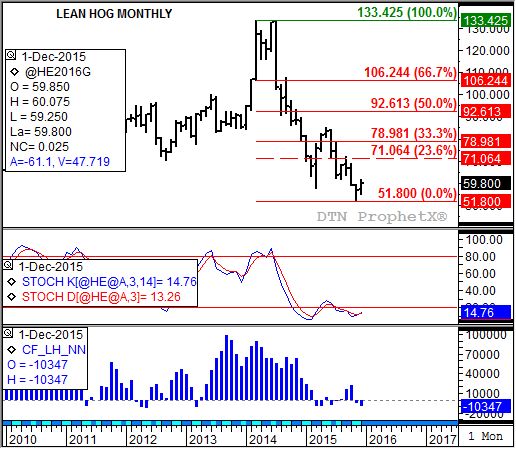
Lean Hogs: The February contract closed at $59.80, up $3.00 on the monthly chart. The major (long-term) trend turned up as the futures market rallied off its November 2015 low of $51.80, a mark that looks to be the end of Wave C of an Elliott 3-wave downtrend. Monthly stochastics established a bullish crossover below the oversold level of 20%, a confirmation signal of the change in trend. Wave 1 of the newly established 5-wave uptrend could see the market test resistance near $71.05, the 23.6% retracement level of the previous downtrend.
Corn (Cash): The DTN National Corn Index (NCI.X, national average cash price) closed at $3.34, down 12 cents for the month. While the NCI.X remains in its 5-wave major (long-term) uptrend, December's action established a bearish outside range meaning Wave 2 could now lead to a test of support near $3.23. This price marks the 67% retracement level of Wave 1 from the low of $2.8147 (October 2014) through the high of $4.0584 (July 2015). The 76.4% retracement level is down at $3.1082. Monthly stochastics are neutral-to-bearish above the oversold level of 20% indicating additional pressure could be seen.
Soybean meal: The March contract closed at $265.50, down $19.80 on the continuous monthly chart. The major (long-term) trend is down as the market moved to a new low of $265.00 during December. Monthly stochastics remain in single-digits indicating the market is sharply oversold.
To track my thoughts on the markets throughout the day, follow me on Twitter: www.twitter.com\DarinNewsom


Comments
To comment, please Log In or Join our Community .