
Technically Speaking
Monthly Analysis: Grain Markets

Corn (Cash): The DTN National Corn Index (NCI.X, national average cash price) closed at $3.40, down 3 cents for the month. The NCI.X remains in a major (long-term) 5-wave uptrend pattern, holding support between $3.44 and $3.23 during August. These prices mark the 50% and 67% retracement levels of the rally from $2.81 (October 2014) through $4.06 (July 2015). Monthly stochastics remain bullish.
Corn (Futures): The December contract closed at $3.72 3/4, down 8 1/2 cents on the monthly chart. Despite another lower monthly close, technical indicators continue to show the major (long-term) trend is up. The August low of $3.57 1/2 was a test of support near $3.63 1/2, a price that marks the 675 retracement level of the rally from $3.18 1/4 (October 2014) through $4.54 1/4 (July 2015). Monthly stochastics remain bullish.
P[L1] D[0x0] M[300x250] OOP[F] ADUNIT[] T[]
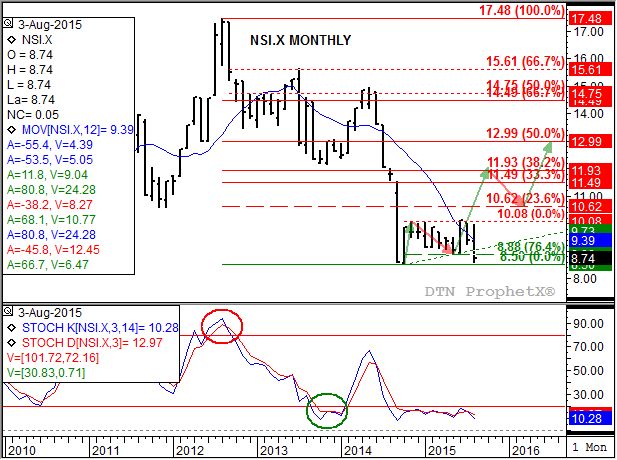
Soybeans (Cash): The DTN National Soybean Index (NSI.X, national average cash price) closed at $8.72, down $0.66 for the month. The major (long-term) trend is sideways with support at the October 2014 low of $8.50. Given that resistance remains near $10.08, a bearish breakout below support would imply a possible move to near $6.92.
Soybeans (Futures): The November contract closed at $8.81 1/2, down 58.75 cents on the monthly chart. The market remains in a major (long-term) downtrend after posting a new low of $8.55 during August. Monthly stochastics continue to show the market is oversold, but this has not generated buying interest over the last two months.
Wheat (Cash): The DTN National SRW Wheat Index (SR.X, national average cash price) closed at $4.26, down 18 cents for the month. The major (long-term) trend remains sideways-to-down after the SR.X posted a new low of $4.20 during August. Monthly stochastics dipped back below the oversold level of 20%.
SRW Wheat (Futures): The September Chicago contract closed at $4.83 1/4, down 16 cents on the monthly chart. The major (long-term) trend remains sideways. Support is at the May 2015 low of $4.60 3/4 while resistance at thee December 2015 high of $6.77 continues to hold. Monthly stochastics are neutral-to-bullish, holding near the oversold level of 20%.
To track my thoughts on the markets throughout the day, follow me on Twitter: www.twitter.com\DarinNewsom
Comments
To comment, please Log In or Join our Community .