

Technically Speaking
Weekly Analysis: Grain Markets

Corn (Cash): The DTN National Corn Index (NCI.X, national average cash price) closed at $3.39, down 8 cents for the week. The NCI.X posted a sharp sell-off last week from Monday's high of $3.65 through Wednesday's low of $3.32. The major (long-term) trend remains up with support at $3.31, a price that marks the 50% retracement level of the rally from $2.81 through the high of $4.06. Another key support level is the June low $3.29. A breach of these support levels could set the NCI.X on a path back to last October's low of $2.81. Monthly stochastics remain bullish while weekly stochastics are neutral to bearish.
Corn (Old-crop): The September contract closed 8.75cts lower at $3.64. Sep corn posted confusing technical signals last week, moving to a new low of $3.46 1/2 Wednesday before rallying Thursday and Friday. The contract came within a half-cent of closing a bearish gap on its weekly chart between $3.92 and $3.89 1/4 Monday before starting its sell-off early Tuesday. Weekly stochastics are neutral to bearish though the last secondary (intermediate-term) signal remains a bullish crossover below the oversold level of 20% the week of June 1.
Corn (New-crop): The December contract closed 8.25cts lower at $3.75 1/2. Similar to September corn, Dec corn's weekly chart shows a number of confusing patterns, though ultimately last week's move to a new low looks to be bearish. Monday saw the contract close a bearish gap between $4.02 and $3.39 1/2 on its weekly chart, before a strong sell-off Tuesday and Wednesday led to a new low of $3.57 1/2. The market then rallied Thursday and Friday, though not enough to close higher for the week and establish a bullish reversal. Trade volume and volatility also increased on the weekly chart while the carry in the December to March futures spread strengthened. All of these technical factors could be interpreted as bearish.
P[L1] D[0x0] M[300x250] OOP[F] ADUNIT[] T[]
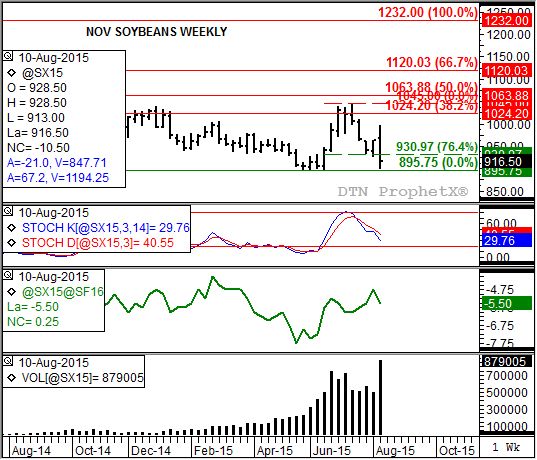
Soybeans (Cash): The DTN National Soybean Index (NSI.X, national average cash price) closed at $9.16, down 50 cents for the week. Though technical indicators continue to show the trend of the cash soybean market is sideways, the sharp sell-off by the NSI.X last weekly erased eight weeks of building bullish momentum. This put the NSI.X within striking distance of technical support at $9.02, trendline support at $9.01, and its previous low of $8.89 from the week of May 18.
Soybeans (Futures): The November contract closed 46.75cts lower at $9.16 1/2. Last week's bearish action saw Nov beans come within 5 cents of establishing a new contract low below $8.96 3/4 (week of June 1). With the pattern on the contract's daily chart looking like a bear flag, the contract could see renewed selling this coming week that would take it to a new low. If so it would erase previous bullish patterns on the market's long-term monthly chart and set the stage for an extended sell-off, despite monthly stochastics showing soybeans to be sharply oversold already.
Wheat (SRW futures): The December Chicago contract closed 4.00cts lower at $6.11 3/4. As with the other grains, December Chicago wheat's weekly chart is showing a number of conflicting signals. The contract posted a bearish outside week last week, testing its previous low of $4.85 3/4 before posting a solid rally. This may have established a double-bottom with the interim high all the way up at $5.23 3/4. Support continues to come from commercial buying with uptrends in both the September to December and December to March futures spreads strengthening. On the other hand, Friday's CFTC report showed noncommercial traders adding 1,667 contracts to their net-short futures position.
Wheat (HRW futures): The December Kansas City contract closed 3 3/4cts lower at $5.10. Last Friday's session had the contract in position to establish a bullish reversal on its weekly chart before a late round of selling took it back below the previous week's settlement of $5.13 3/4. Weekly stochastics are showing the contract in an oversold situation, setting the stage for a possible bullish turn in the coming weeks. Support is at last week's new contract low of $4.91.
Wheat (HRS futures): The December Minneapolis contract closed 7.50cts lower at $5.33 3/4. The move to a new contract low indicates the secondary (intermediate-term) trend remains down. Support is at the new low of $5.21 1/4. Weekly stochastics indicate the market has moved back into an oversold situation.
The weekly Commitments of Traders report showed positions held as of Tuesday, August 11.
To track my thoughts on the markets throughout the day, follow me on Twitter: www.twitter.com\DarinNewsom
Comments
To comment, please Log In or Join our Community .