

Technically Speaking
Weekly Analysis: Grain Markets
Corn (Cash): The DTN National Corn Index (NCI.X, national average cash price) closed at $3.34, unchanged for the week. Cash corn remains in a secondary (intermediate-term) sideways trend. Resistance is at $3.47, a price that marks the 33% retracement level of the previous downtrend from $3.80 through the recent low of $3.31. Support is at $3.31, the 50% retracement level of the uptrend from $2.81 through the high of $3.80. Weekly stochastics are neutral below the oversold level of 20%.
Corn (Old-crop): The July contract closed 0.25cts higher at $3.53.25. The secondary (intermediate-term) trend remains sideways as the nearby July contract (still being used for cash price calculations and registering on the continuous monthly chart) holds above it double-bottom at $3.46 3/4. A break of this secondary support could lead to a test of major (long-term) support at the October 2014 low of $3.18 1/4.
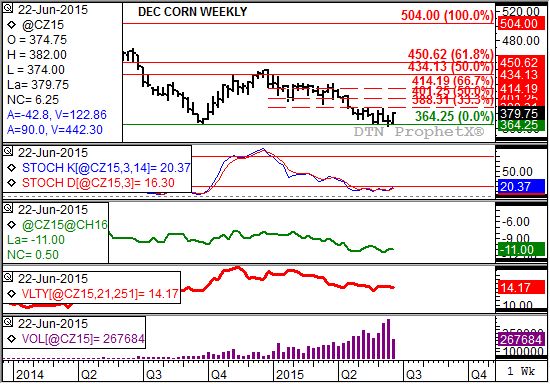
Corn (New-crop): The December contract closed 0.75cts lower at $3.68 3/4. Last week's move to a new contract offsets the bullish reversal posted the week of June 1, indicating the secondary (intermediate-term) trend is sideways-to-down. Despite weekly stochastics below the oversold level of 20%, noncommercial traders continue to pressure the corn market in general. Friday's weekly CFTC Commitments of Traders report showed this group increasing their net-short futures position by 40,138 contracts.
P[L1] D[0x0] M[300x250] OOP[F] ADUNIT[] T[]
Soybeans (Cash): The DTN National Soybean Index (NSI.X, national average cash price) closed at $9.39, up 30 cents for the week. The NSI.X extended its secondary (intermediate-term) uptrend, though unable to move through initial resistance near $9.50. The consecutive weeks of April 27 and May 4 saw highs of $9.50 and $9.48 respectively. Weekly stochastics are bullish, indicating the NSI.X should extend this uptrend to resistance at $10.03. This price marks the 23.6% retracement level of the downtrend from $14.97 through the low of $8.50.
Soybeans (old-crop): The July contract closed 31.50cts higher at $9.71 1/2 last week. July soybeans (still used in calculating cash price) posted a number of bullish technical signals last week, including a bullish outside week and a new 4-week high. All while trade volume for the week (681,222 contracts) increased from the previous week (637,767 contracts). Indications are that the secondary (intermediate-term) uptrend continues to strengthen, with Friday's weekly CFTC Commitments of Traders report showing noncommercial interests reduction their net-short futures holdings by 18,169 contracts.
Soybeans (new-crop): The November contract closed 35.50cts higher at $9.39 3/4 last week. November soybeans extended the recently established secondary (intermediate-term) uptrend, posting similar bullish technical signals as the old-crop July contract with a sharp increase in trade volume (580,685 contracts compared to the previous week's 417,981 contracts). Unlike the July though, support also came from commercial buying with the carry in the November to January futures spread trimmed by 1 1/2 cents to close at 5 3/4 cents.
Wheat (Cash): The DTN National HRW Wheat Index (HW.X, national average cash price) closed at $4.68, down 22 cents for the week. The weekly chart remains a mix of gaps, indicating the secondary (intermediate-term) trend remains sideways. Resistance is at the recent high of $5.19 (week of May 18) and support the recent low of $4.49 (week of April 27). Seasonally (using both 5-year and 10-year indexes) the HW.X tends to post a low the last full week of June through the first weekly close July, a timespan covering the next two weeks.
HRW Wheat: The July Kansas City contract (still used for calculating cash prices) closed 22.75cts lower at $5.03 1/4. The secondary (intermediate-term) trend is sideways again, with resistance at the recent high of $5.64 1/2 (week of May 18) and support at the contract low of $4.85 1/2. Weekly stochastics are neutral above the oversold level of 20% with the last trend-indicating signal a bullish crossover below 20% the week of May 4.
SRW Wheat: The July Chicago contract (still used for calculating cash prices) closed 15.25cts lower at $4.88 1/2. The secondary (intermediate-term) trend is now sideways with resistance is at the 4-week high of $5.37 1/2 and support at the contract low of $4.60 3/4. Weekly stochastics are neutral, above the oversold level of 20%. The most recent trend-indicating signal was a bullish crossover below 20% the week of May 4.
The weekly Commitments of Traders report showed positions held as of Tuesday, June 16.
To track my thoughts on the markets throughout the day, follow me on Twitter: www.twitter.com\DarinNewsom

Comments
To comment, please Log In or Join our Community .