

Technically Speaking
March Beans Slide to Trendline Test

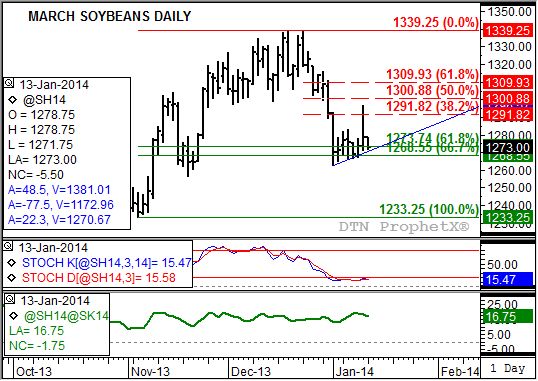
After its pre-report spike rally Friday the March soybean contract has struggle to generate buying enthusiasm, with early Monday morning finding the contract closer to a test of key support than resistance. The interesting thing is, much of the selling is coming from the commercial side of the market as indicated by action in the March to May futures spread (third study, green line).
Take a look at the daily price chart (top chart). Early Friday morning saw strong commercial buying push the March into resistance between $12.91 3/4 and $13.01. These prices are approximately the 38.2% and 50% retracement levels of the previous downtrend from $13.39 1/4 (December 23, 2013) through the low of $12.62 1/2 (January 2, 2014). Notice how the rally came to an immediate halt with the contract able to post only a modest 4 3/4 cent daily gain at Friday's close.
Follow-through pressure from commercial traders has turned the tide as quickly as a professional wrestling match, with March soybeans now on the ropes between support near $12.73 3/4 and $12.68 1/2. These prices marks the 61.8% and 67% retracement levels of the previous longer-term uptrend from $12.33 1/4 (November 5, 2013) through the December 23 high. Also note that trendline support connecting recent lows comes in near $12.70 3/4 Monday, with the contract posting an overnight low of $12.71 3/4.
Daily stochastics (second study) are holding below 20% showing the contract remains oversold and in position for a possible rally. However, this same signal has failed to sustain buying enthusiasm recently.
What is the worst case scenario for market bulls? If you look at the top chart again, squinting your eyes just right, the pattern looks eerily similar to a bearish flag continuation pattern. If so, the flag pole would have started at the beginning of the bearish breakdown with a move below $13.06 (the interim low between the double-tops) and the previously mentioned January 2 low ($12.62 1/2). Price measurement shows the flag pole to cover to be approximately 43 cents. Subtracting that amount off a break of the previously mentioned trendline support at roughly $12.70 results in a target price near $12.27, keeping in mind that buying could be found near the longer-term low of $12.33 1/4.
To track my thoughts on the markets throughout the day, follow me on Twitter: www.twitter.com\Darin Newsom
Commodity trading is very complicated and the risk of loss is substantial. The author does not engage in any commodity trading activity for his own account or for others. The information provided is general, and is NOT a substitute for your own independent business judgment or the advice of a registered Commodity Trading Adviser.
P[L1] D[0x0] M[300x250] OOP[F] ADUNIT[] T[]
Comments
To comment, please Log In or Join our Community .