

Technically Speaking
Chicago Wheat's "Believe it or Not" Outlook

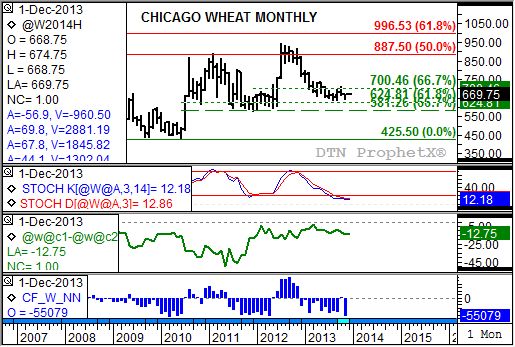
As December gets under way the Chicago wheat market seems content to move sideways. However, the not too distant futures could see major (long-term) momentum indicators swing to a more bullish outlook. If so that would mean the recent low of $6.35 1/2 (August 2013) should hold.
You may have to take a close look at the monthly chart for Chicago wheat, particularly if your eyes are as bad as mine. You will notice that the more active contract has been holding between support near $7.00 1/2 and 6.24 3/4, prices that mark the 50% and 61.8% retracement levels of the previous uptrend from $4.25 1/2 (June 2010) through the high of $9.47 1/4 (July 2012).
P[L1] D[0x0] M[300x250] OOP[F] ADUNIT[] T[]
Also, monthly stochastics (second study) show the market to be in an oversold situation with both the faster moving blue line and slower moving red line below the 20% level. However, also notice that these two are coming together as the futures market holds support, setting the stage for a bullish crossover (blue line crossing above red line with both below 20%) possibly by the end of this month.
Fundamentally the market remains neutral at best, despite the solid weakening of the carry seen over the last couple of years (third study, green line). This could change dramatically at the end of this month though as the March to May Chicago spread takes the lead after the December contract expires December 13. As of this writing, the March to May spread is showing a carry of only 5 cents, reflecting a far more bullish commercial outlook. This could prove to be enough incentive to spark another round of noncommercial short-covering, providing the buying interest needed to start a major (long-term) uptrend. CFTC Commitments of Traders reports show this group holding a net-short futures position of 55,079 contracts in late November (bottom study, blue histogram).
Combining all these factors (futures holding support, momentum indicators in oversold situation, increasingly bullish spreads, and noncommercial short-covering) the upside target would be $8.87 1/2, the 50% retracement level of the previous major downtrend from the spike high of $13.49 1/2 (February 2008) through the previously mentioned low of $4.25 1/2. If the spreads turn more bullish, an extended rally to the 61.8% retracement level of $9.96 1/2 is possible.
To track my thoughts on the markets throughout the day, follow me on Twitter: www.twitter.com\DarinNewsom
Commodity trading is very complicated and the risk of loss is substantial. The author does not engage in any commodity trading activity for his own account or for others. The information provided is general, and is NOT a substitute for your own independent business judgment or the advice of a registered Commodity Trading Adviser.
Comments
To comment, please Log In or Join our Community .