

Technically Speaking
"The Widow Maker" Remains on a Roll

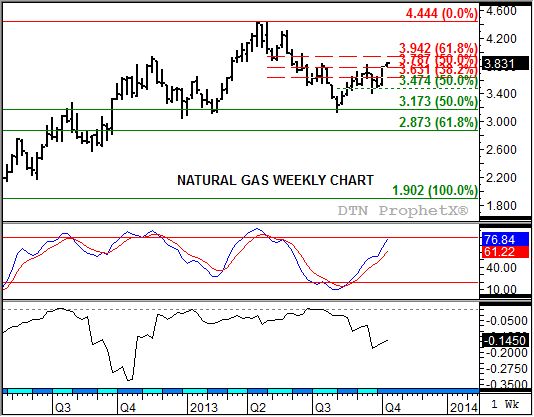
Natural gas' nickname "The Widow Maker" is well earned. Its history of sharp, logic defying changes in trend has done wonders for the home blood-pressure industry, challenging only the legendary pork belly market in terms ofcardiovascular distress. Yet it is this same market that has been adhering closest to its technical signals since late April 2013.
If you look back on the weekly chart, the spot-month natural gas contact established a bearish key reversal the week of April 29. The contract posted a new high of $4.444 before falling below the previous week's low of $4.062 and closing lower for the week. Reversals remain one of the more reliable technical signals I look for, with this one occurring in conjunction with a bearish crossover by weekly stochastics (middle study) above the overbought level of 80%. Both indicate a change in trend, and when combined usually result in strong move in the opposite direction.
P[L1] D[0x0] M[300x250] OOP[F] ADUNIT[] T[]
Note that this time around natural gas did as expected and sold off. Through the week of August 5 the market fell to a low of $3.129, a test of the 50% ($3.172) retracement level of the previous uptrend from $1.902 through the aforementioned high, before settling that week at $3.230. The week of August 19 saw weekly stochastics follow suit with a bullish crossover below the 20% level, confirming the move to an uptrend indicated by the quickly rallying futures market.
Since then the spot-month contract has been testing resistance levels at $3.631 and $3.787, prices that mark the 38.2% and 50% retracement levels of the previous downtrend, until recently setting its sights on the 61.8% retracement level of $3.942. Notice that even its minor sell-off over the last half of Septemberresulted in only atest ofsupport at $3.474,the 50% retracement level of the initial rally.Given that weekly stochastics remain bullish (nearing the overbought level of 80% with the faster moving blue line above the slower moving red line) momentum continues to favor the upside.
The potential rally could be limited by the strength of the carry in the nearby futures spread (bottom study). This continues to indicate a neutral to bearish commercial outlook.
Given this structure (solid secondary uptrend, neutral to bearish commercial outlook), the 61.8% retracement level of $3.942 should hold the rally, with a test of the previous high of $4.444 an outside shot at best.
To track my thoughts on the markets throughout the day, follow me on Twitter: www.twitter.com\DarinNewsom
Comments
To comment, please Log In or Join our Community .