

Technically Speaking
Short-term Signals in Soybeans

The last shot USDA took before the government shutdown was the surprisingly bearish quarterly stocks number for soybeans. As the gates came down on the government's castle, bearish headlines drove the soybean market down while those who track the actual fundamentals of the market were left scratching their heads. Now, two days later, USDA is nowhere to be seen and the soybean market is starting to build bullish momentum.
As discussed in this blog the afternoon of September 30, after the fallout of the quarterly stocks report, the long-term monthly chart remains bullish for soybeans. Now though, the short-term daily chart is also establishing a number of bullish signals indicating the minor (short-term) trend may be in the process of turning up again.
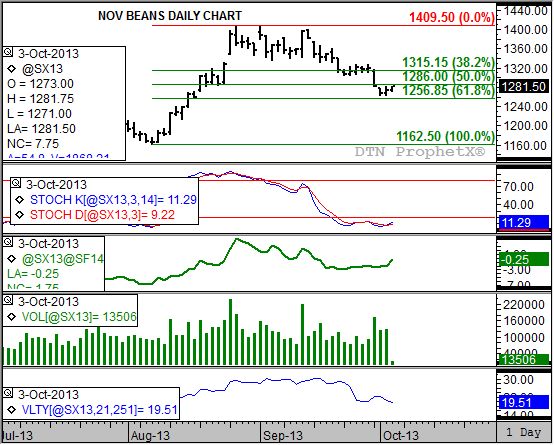
Start with the daily price chart itself (top study). Notice that the November contract has held key price support near $12.56 3/4 (the same level discussed in the look at the monthly chart), a price that marks the 61.8% retracement level of the rally from the August low of $11.62 1/2 through the August high of $14.09 1/2. After posting a low of $12.63 1/2 Tuesday (October 1), the November contract has rallied to a high of $12.81 3/4 through early Thursday morning.
Daily stochastics (second study) is indicating this week's move may be more than a consolidation above technical price support, establishing a bullish crossover. This occurs when the faster moving blue line crosses above the slower moving red line, with both below the oversold level of 20%. On the daily chart this pattern tends to indicate the short-term trend is turning up.
P[L1] D[0x0] M[300x250] OOP[F] ADUNIT[] T[]
Also note that daily volume (fourth study, green histogram) increased Thursday as the November contract moved higher. Historically, increased trade volume as a contract (or market) rallies has been viewed as a bullish sign. However, we need to see this for more than one day.
One reason volume could go up is if noncommercial buying interest continues to grow. And this group, noncommercial traders, is attracted to markets with two distinct characteristics: low volatility and bullish fundamentals. In regards to the former, daily market volatility (bottom study) has moved below 20%, its lowest level since early July 2013.
As for fundamentals, the trend in the November to January futures spread (third study, thick green line) has turned up again with the carry whittled to near par. An uptrend in the spread indicates renewed commercial buying interest, reflecting the idea that the market itself believes the supply and demand situation is tightening. It would not be surprising to see the Nov/Jan spread move into an inverse given the strong likelihood that the recent USDA inspired sell-off created increased export demand.
To track my thoughts on the markets throughout the day, follow me on Twitter: www.twitter.com\DarinNewsom
Commodity trading is very complicated and the risk of loss is substantial. The author does not engage in any commodity trading activity for his own account or for others. The information provided is general, and is NOT a substitute for your own independent business judgment or the advice of a registered Commodity Trading Adviser.
Comments
To comment, please Log In or Join our Community .