

Technically Speaking
US Dollar Index Drifting Lower

The U.S. government shutdown Monday at midnight reminded me of the proverbial question; if a tree falls in the forest and nobody is around to hear it, does it make a sound? A look at the markets early Tuesday morning would indicate the answer is "no".
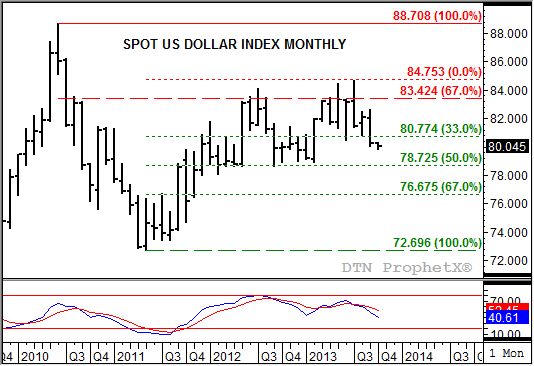
As September came to an end, the spot U.S. dollar index was in the process of establishing a technical signal on its monthly chart. Notice how it had traded above the August high of 82.494 and below the August low of 80.754, before settling for the month at 80.221. This creates a bearish outside month and indicates the index should continue to move lower in its major (long-term) sideways to down trend.
The September close was below support at 80.774, the 33% retracement level of the previous uptrend from 72.696 (the low from May 2011) through 84.753 (the high from July 2013). Next support is at the 50% retracement level of 78.725. Note that this price is near a series of lows from January 2012 through May 2012 as well as September 2012 through February 2013.
Monthly stochastics are also indicating the index could continue to move lower. At the end of September, the faster moving blue line was below the slower moving red line, with both in neutral territory. Stochastics should continue to move toward the oversold level of 20% in the coming months.
As a result of possible technical weakness in the U.S. dollar index, other markets could find renewed buying interest. The Canadian Dollar, gold, crude oil, and possibly grains could all start to see increased noncommercial buying interest, or in some instances at least light short-covering activity, over the coming months.
To track my thoughts on the markets throughout the day, follow me on Twitter: www.twitter.com\DarinNewsom
P[L1] D[0x0] M[300x250] OOP[F] ADUNIT[] T[]
Comments
To comment, please Log In or Join our Community .