

Technically Speaking
Beans Still Long-Term Bullish

Soybeans can't trade higher on a Monday anymore. Since posting a solid rally the Tuesday after Labor Day, Monday's have brought losses in the November contract of 11 1/4 cents (September 9) 33 1/4 cents (September 16), 7 1/2 cents (September 23), and 37 cents (September 30). All told Monday has accounted for a loss of 89 cents, while the November lost a total of 74 3/4 over the course of September's trade. Again note that about half of that loss occurred the last trading day of the month.
But despite beans' Garfield like hatred of Monday's, the long-term monthly chart remains bullish. Yes, you read that right and no, it isn't a hallucination at the end of another long report day.
P[L1] D[0x0] M[300x250] OOP[F] ADUNIT[] T[]
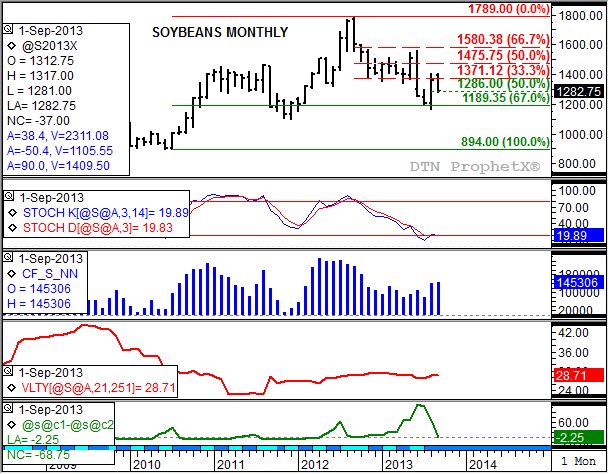
Take a look at the monthly price chart (top chart). As discussed in the blog post from August 19 ("A Long-Term Bullish Signal Brewing in Beans"), the November contract did indeed establish a bullish key reversal in August, setting the stage for a long-term uptrend. And even though the market dropped almost 75 cents in September, monthly stochastics (second study) shows a bullish crossover being established, confirming the technical signal seen in August. A bullish crossover in stochastics means the faster moving blue line crossed above the slower moving red line, with both below the oversold level of 20%. In this case, the end of September saw bean monthly stochastics finish at 19.89 (blue line) and 19.83 (red line).
Adding support to the bean market is the still bullish commercial outlook. Yes, the nearby futures spread (bottom study, green line) has seen a solid downtrend emerge but the 2 1/4 cent carry in the November to January futures spread at the end of September continues to reflect only a small percentage of full cost of carry, meaning the outlook remains bullish. Taking into account the market's inverted forward curve through the balance of the 2013-2014 marketing year (January through July, not shown), and one could argue the long-term supply and demand situation is far more bullish than what USDA would suggest.
But what of the September sell-off? Notice that the November contract closed the month at $12.82 3/4. This puts it just below technical price support at $12.86 (top chart, dashed green line), a price that marks the 50% retracement level of the August rally from $11.62 1/2 to $14.09 1/2. Given that the commercial outlook (futures spreads) remains bullish, the 50% retracement level should hold this sell-off. If not, the 61.8% retracement level is down near $12.56 3/4.
Those familiar with my analysis are familiar with the connection between trend and noncommercial (investment, fund, speculative, etc.) activity. Notice that this group, according to CFTC's Commitments of Traders report, held a net-long futures position of about 145,300 contracts as of Tuesday, September 24 (third study, blue histogram). In order for the long-term uptrend to gain strength, this group will need to start adding to their position. But why would they do that?
To begin with, again, the long-term commercial outlook remains bullish. As long as market fundamentals suggest a tightening situation, investment traders are normally willing to buy. Second, market volatility (fourth study, thick red line) remains neutral at about 28.7%, stuck between the highs seen in late 2009 and lows seen in early 2011. Investment traders don't like markets with high volatility due to increased risk. This could make soybeans a reasonably attractive market to this group in the near future.
To track my thoughts on the markets throughout the day, follow me on Twitter: www.twitter.com\DarinNewsom
Comments
To comment, please Log In or Join our Community .