

Technically Speaking
DJIA: Where There's Smoke There May Be Fire

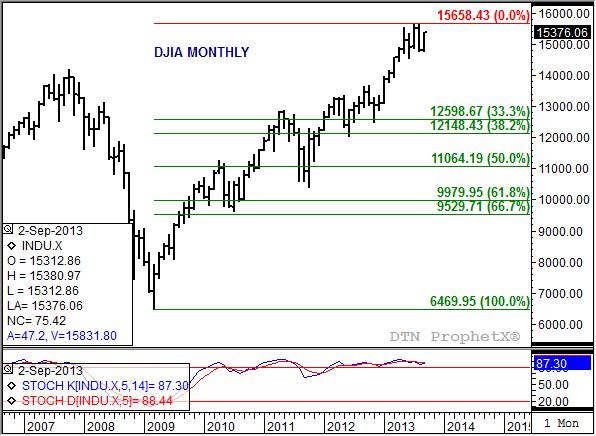
It has been five-years since the U.S. found itself in the midst of a financial collapse, an event that claimed many of the largest financial institutions. A look at the long-term monthly chart shows how the Dow Jones Industrial Average stabilized in early 2009, leading to the strong rally seen through early fall of 2013. But as we approach the seemingly always critical month of October, talk in the market is of another coming collapse. Usually talk amounts to little, but in this case, the long-term chart seems to agree.
If we trace this uptrend back on the monthly chart, we see that the DJIA posted a spike low of 6,469.97 in early March 2009. By the end of the month, the Dow had rallied to a close of 7,608.92. Along with this move in equities, monthly stochastics established a bullish crossover below the oversold level of 20% at the end of April. This confirmed the idea the DJIA had moved into a long-term uptrend.
Fast forward over the last four and a half years, and the chart shows monthly stochastics consistently holding above the overbought level of 80% since April 2010. Along the way there has been countless potential bearish crossovers (the faster moving blue line crossing below the slower moving red line) that turned out to be nothing but false signals. Notice though that the latest bearish crossover occurred at the end of August 2013. And while this could be another head fake, other technical signals may be confirming equities are indeed set to fall.
Take a look at the action in the stock market in August. The DJIA moved to a new all-time high of 15,658.43 (August 2) before falling back below the July low of 14,858.93 (August 27) before closing lower for the month. In other words, the Dow established a classic key bearish reversal on its long-term monthly chart.
Yes, the DJIA has rallied again in September, but has not yet moved to a new high. Monthly stochastics remain in an overbought and bearish situation, with the blue line last calculated at 87.3% and the red line at 88.4%. In other words, the bearish flags continue to fly indicating that U.S. equities have likely established a top.
If so, the initial downside target is 12,598.67, a level that marks the 33% retracement of the previous uptrend from the March 2009 low through the August 2013 high. Below that is the 50% retracement level of 11,064.19. It is unlikely, but not impossible, that the DJIA sees a 67% retracement back to 9,529.71. The previous downtrend (November 2007 through March 2009) last 17 months. Projecting that same timeframe forward puts a possible low occurring in January 2015.
To track my thoughts on the markets throughout the day, follow me on Twitter: www.twitter.com\Darin Newsom
P[L1] D[0x0] M[300x250] OOP[F] ADUNIT[] T[]
Commodity trading is very complicated and the risk of loss is substantial. The author does not engage in any commodity trading activity for his own account or for others. The information provided is general, and is NOT a substitute for your own independent business judgment or the advice of a registered Commodity Trading Adviser.
Comments
To comment, please Log In or Join our Community .