
Technically Speaking
A Long-term Bullish Signal Brewing in Beans

I had every intention of posting a blog discussing November soybeans weekly chart this morning, until I took another look at the major (long-term) month chart. This picture of the market, to me, is the key to future price trends, particularly if the major signal that is possibly being established in August is completed.
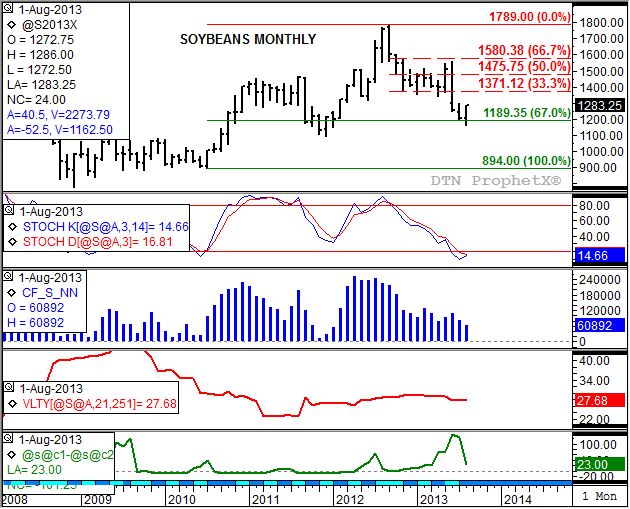
Take a close look at the monthly price chart (top study). Notice how in August the most active November contract set a new low of $11.62 1/2, a test of retracement support near $11.89, before staging an impressive rally. Through trade early Monday (August 19), the contract has posted a monthly high of $12.86. The high in July was $12.97. If November beans can trade above the July high, and close higher for the month (the July settlement was $12.06 1/4, then a bullish key reversal will be established.
As the name indicates, a key reversal on a monthly chart usually indicates a major (long-term) change in price direction. The previous one visible on this chart was also bullish, occurring in July 2010 as the more active November 2010 posted a low of $8.94. Take a look at the histogram showing the CFTC Commitments of Traders report noncommercial net-futures position (third study, monthly) and you see that as this pattern was being established noncommercial traders were adding to their net-long futures position. For those wondering, the peak in September 2012 was close, though the November contract did not quite trade below the August low of $15.55 1/4, moving to only $15.57 1/2 by the end of the month.
If a bullish key reversal is established in August, or in other words the November contract moves above the July high and closes higher for the month, the initial upside target would be near $13.71. This price marks the 33% retracement level of the previous major (long-term) downtrend from the September 2012 high of $17.89 through this month's low. However, given the continued bullish commercial outlook indicated by the inverted forward curve of the market (Not shown. The spread on this chart is the bottom study that still shows the nearby September to November, an unreliable gauge of commercial outlook) soybeans should see at least a 50% retracement to near $14.75, and possibly a 67% retracement to near $15.80. Naturally, a bearish change in the commercial outlook, could trim the upside target.
To track my thoughts on the markets throughout the day, follow me on Twitter: www.twitter.com\Darin Newsom
Commodity trading is very complicated and the risk of loss is substantial. The author does not engage in any commodity trading activity for his own account or for others. The information provided is general, and is NOT a substitute for your own independent business judgment or the advice of a registered Commodity Trading Adviser.
P[L1] D[0x0] M[300x250] OOP[F] ADUNIT[] T[]
Comments
To comment, please Log In or Join our Community .