

Technically Speaking
Seasonal Sell-off in Crude Oil

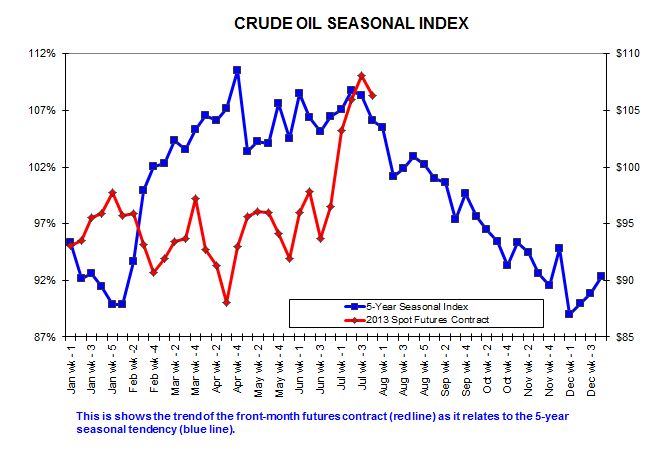
The crude oil market has been in the spotlight lately, first for its impressive rally from its mid-April low near $85.60 through its recent high near $109.30. Recent action has seen a quick sell-off in the market, with the five-year seasonal index showing such a move isn't all that unusual.
A look at the attached chart shows the weekly close for the spot-month futures contract (red line) compared to the weekly five-year seasonal index (blue line). A seasonal index can be created by taking average weekly closes for a set period of time (in this case five years), averaging the 52 average weekly closes, then dividing the individual weekly averages by the 52 week average. The end result is a picture of what a market tends to do over a 12-month period, either a marketing year (grains), or in this case a calendar year.
Notice that in 2013 crude oil established a later than normal low weekly close. Rather than being posted in late January, this year's low weekly close of $88.01 didn't occur until the third week of April. As mentioned above, the market then quickly rallied to what looks to be its high weekly close of $108.05 last Friday, the third week of July. Notice that this is one week later than the normal seasonal high.
From the seasonal high weekly close in mid-July through the initial seasonal low weekly close in early December, the spot-month contract tends to drop 20%. Using this change only establishes a price target for the initial low weekly close of $86.44.
If we compare this to the continuous weekly chart for the spot-month contract (not shown), this would imply a test of the previously mentioned low of $85.60 over the coming months. Weekly stochastics are nearing a bearish crossover, with the faster moving line approaching a move below the slower moving line with both above the overbought level of 80%. This would seem to confirm the idea that the market is moving into a secondary (intermediate-term) downtrend, in step with the seasonal index. However, the forward curve (series of futures spreads, also not shown) in crude oil remains inverted (in backwardation) indicating the market continues to hold a bullish view of supply and demand. Usually, a market with such a strong commercial outlook will see a retracement of its previous uptrend of 33% to 50%, putting more reasonable levels of support between $101.42 and $97.47.
To track my thoughts on the markets throughout the day, follow me on Twitter: www.twitter.com\DarinNewsom
P[L1] D[0x0] M[300x250] OOP[F] ADUNIT[] T[]
Comments
To comment, please Log In or Join our Community .