

Technically Speaking
Trend and the May to Dec Corn Spread
Over the years I've talked a great deal about spreads, most recently in my weekly Newsom On the Market Column "What a Fool Believes". After that column ran, and tied into the hubbub surrounding the bearish quarterly stocks and bullish prospective plantings numbers for corn, I received an email asking the question of what is to become of the May to July corn spread.
Those familiar with this blog and my writings might recall that many, many years ago when I first became a broker/analyst, I bought John J. Murphy's classic "Technical Analysis of the Futures Markets" (1986 edition). Having few clients and plenty of time, I used this as a textbook to teach myself the ins and outs of technical analysis. Over the years I tweaked some of the ideas, and threw out others completely as commodity markets evolved, but still view the book as an invaluable reference item.
Early in the introduction, Murphy describes technical analysis like this: "The technician believes that anything that can possibly affect the market price of a commodity futures contract - fundamental, political, psychological, or otherwise - is actually reflected in the price of that commodity. It follows that a study of price action is all that is required."
P[L1] D[0x0] M[300x250] OOP[F] ADUNIT[] T[]
Now to the question at hand. It follows that if the study of price action encompasses all things that affect a commodity futures contract, the same would hold true for commodity futures spreads. After all, what are spreads but price relationships between two (or more) futures contracts (or option contracts, etc.). Therefore, studying the trend - price action over time - of a spread can give us a good idea of the underlying fundamentals that may be affecting that spread.
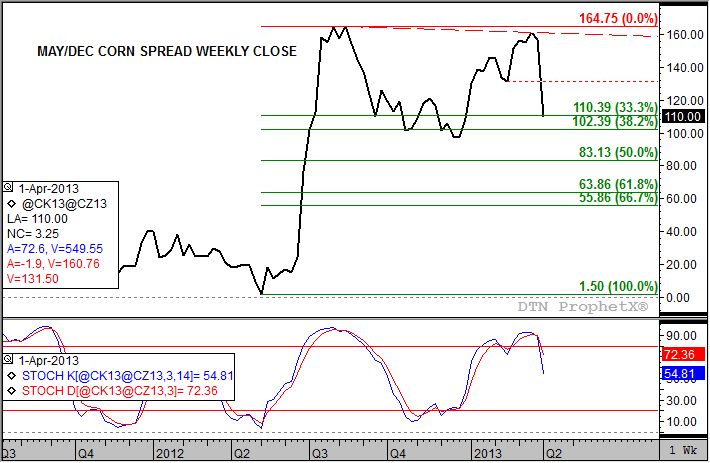
In the case of the May (old-crop) to December (new-crop) corn spread, I'm using the same trend studies that I incorporate into my studies of futures contracts, indexes, options, etc. These are simple chart patterns, Fibonacci and Dow retracement levels, and stochastics (momentum).
Notice that back in August 2012 the spread posted a high of $1.64 3/4 inverse (May contract higher priced than the December) before falling back to a low of a 97 cent inverse (week of December 24, 2012). This was a test of the 38.2% (Fibonacci) retracement level of the previous uptrend from the 1 1/2 cent inverse weekly close (week of May 7, 2012) through the previously mentioned high weekly close the week of August 13, 2012.
How did we know the market was moving into a solid uptrend? Take a look at stochastics for that same time frame (May to August 2012). Weekly stochastics established a bullish crossover (faster moving blue line crossed above the slower moving red line) indicating a bullish change in momentum. As the spread was approaching its peak, actually the weekly close before, weekly stochastics saw a bearish crossover well above the oversold level of 80% (both blue and red lines were actually above 90%). This indicated the momentum was starting to turn down. As the spread fell back to a test of the aforementioned support at the Fibonacci retracement, stochastics had fallen back below the oversold level of 20% establishing yet another bullish crossover the week of November 12, 2012.
The subsequent uptrend saw the spread test the previous high of $1.64 3/4, posting a top at $1.61 (week of March 18, 2013). Notice that the following week, weekly stochastics established yet another bearish crossover setting the stage for the downtrend the spread now finds itself in. This downtrend has seen the spread quickly approach support at the 33% (Dow Theory) retracement level near $1.10 1/2, with possible support at the previous low sitting just below.
But, take yet another look at stochastics. Neither the blue nor the red line is near oversold at 20% at this time. This means the spread could move below the previous low, setting up a test of the 50% retracement (both Fibonacci and Dow) level near 83 cents. If that level fails to hold the spread could fall all the way back the support between 63 3/4 cents (Fibonacci 61.8% retracement) and 55 3/4 cents (Dow 67% retracement).
What are the fundamentals at play at this time? The mid-March move to a downtrend by weekly stochastics hinted at increasingly bearish old-crop supply and demand, increasingly bullish new-crop supply and demand, or some combination of the two. Fast forward to the March 28 report where the larger than expected (according to pre-report estimates) quarterly stocks estimate of 5.399 bb can be projected to a 2012-2013 ending stocks figure of 885 mb (as compared to USDA's March estimate of 632 mb). Corn prospective plantings (2013-2014 new-crop) came in well below pre-report estimates at 97.28 million acres, up only slightly from the 2012-2013 planted acreage estimate of 97.2 ma. In other words, the end of March reports were decidedly bearish for old-crop and bullish for new-crop, just as the trend in the spread had been hinting at beforehand.
To track my thoughts on the markets throughout the day, follow me on Twitter: www.twitter.com\DarinNewsom

Comments
To comment, please Log In or Join our Community .