
Technically Speaking
Beans Still Look Bullish

Last August, one of my weekly Newsom On the Market columns talked of the continued change in the dynamics of the grain markets with the extension of trading hours (“The 100 Hour-Plus Trading Day”), In it I discussed the view that the move to 21 hours of trading every day made daily charts obsolete, making one week-long session broken up by a short three-hour intermission.
The subject sprang to life following the beat down of the soybean market that saw contracts establish bearish key reversals (higher highs than the previous day, lower lows, lower closes) on a number of daily charts. Technically speaking, this would indicate the market is set for a minor (short-term) downtrend that could see the more active May contract test its recent low of $13.93 1/2 in relatively short order.
However, for those that believe (myself included) the weekly chart now reflects one extended trading session, bearish ideas remain in hibernation where soybeans are concerned.
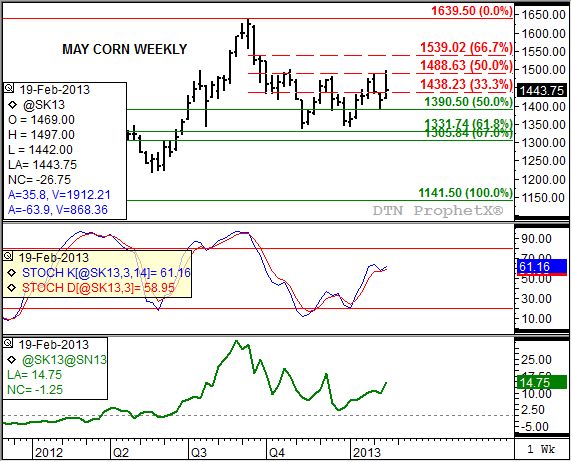
By definition, an uptrend exists when a market posts successively higher highs and higher lows. Take a look at the weekly chart for the May soybean contract. Going back to November 2012 the contract has posted lows of $13.37 3/4, $13.44, and the aforementioned $13.93 1/2. Along with that the highs have been $14.81, $14.89 1/2, and $14.97 with the last two occurring only two weeks apart, the latest this past week.
Most of you know that I use few technical indicators to confirm trend. On the weekly chart itself, you will notice I track both Fibonacci and Dow retracement levels. For a momentum indicator I track weekly stochastics (middle study). Notice that a bullish crossover (faster moving blue line crossing over the slower moving red line below the oversold 20% line) was established two weeks after the futures contract posted its initial low last November. This would signal that the secondary (intermediate-term) trend had turned up after holding above technical price support near $13.31 3/4 (61.8% retracement level of the previous uptrend from $11.41 1/2 through last summer’s high of $16.39 1/2). The trend that was indicated then remains in play today as stochastics slowly move toward overbought at 80% (this last week stochastic finished at 61.16% and 58.95%).
Fundamentally, the market is growing more bullish as well. The May to July futures spread (bottom study, green line) is also in an uptrend reflecting a strengthening inverse. Friday close with the May 14 3/4 cents over the July is the strongest this inverse has been since its peak of 18 1/2 cents the week of December 10, 2012. Given that the weekly trend remains up and the futures spreads reflect a more bullish commercial outlook, the structure of the market is growing increasingly bullish.
The five-year seasonal index for soybeans (not shown) shows that the market tends to trend sideways to up from mid-January through mid-April. Weekly closes for the 2012-2013 futures market show that soybeans are largely in step with the seasonal index, with the more active May contract needing a weekly close above $14.74 1/4 and the DTN National Soybean Index (national average cash price) above $14.55 (calculated this past Friday at $14.39) to indicate a bullish breakout of this seasonal sideways trend.
P[L1] D[0x0] M[300x250] OOP[F] ADUNIT[] T[]
What lies ahead for soybeans? Given its bullish structure, it would be hard to argue for an extended move lower. However, the seasonal sideways pattern could see the May contract test support at its recent low ($13.93 1/2), also a test of support at the longer-term 50% retracement level of $13.90 1/2. Ultimately, the seasonal index shows the market tends to rally 19% from the weekly close the third week of February. If so, this would project to a high in early July between $17.15 and $17.20 (is so, it would be in the July contract). However, both the weekly and monthly charts show that target might be a bit ambitious. The May soybean weekly chart shows retracement resistance between $14.88 and $15.39, while the month chart for soybeans (not shown) has resistance between $15.80 and $16.50.
To track my thoughts on the markets throughout the day, follow me on Twitter: www.twitter.com\DarinNewsom
Comments
To comment, please Log In or Join our Community .