Fundamentally Speaking
Late Push in SX/CZ Ratio
Heading into the Prospective Plantings report, trade is expecting 2024 U.S. corn plantings at 91.776 million acres, down 3% from 2023's 94.6 million level but up slightly from the 91 million acres the USDA projected for 2024 back in February.
Soybean plantings are seen at 86.53 million acres, up 3.5% from last year but below USDA's February projection of 87.5 million.
One reason for this is U.S. farmers notoriously love to plant corn as it appears that corn yields have held up better than bean yields in recent years.
Seeing that the U.S. corn/soybean yield ratio has increased for the three past seasons and while corn yields were an all-time high last year, it has been since 2016 the last time the U.S. set a national soybean yield record.
P[L1] D[0x0] M[300x250] OOP[F] ADUNIT[] T[]
It could also be that the economics of planting corn may have looked better last fall than it does now when a lot of preseason work was done.
Ideas that a warm and dry winter could result in an early start to corn plantings may also be a reason trade average estimates are higher than the USDA Outlook Forum estimate, though wintry weather over past week has put such talk to bed at least for now.
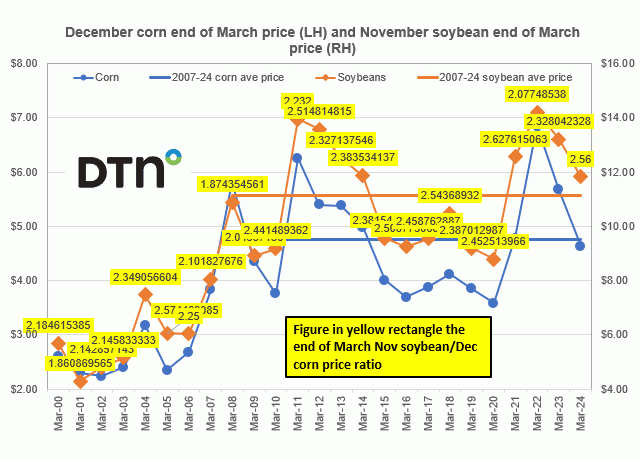
On the other hand, university return per acre studies are all in favor of soybeans while the current SX/CZ ratio of 2.56 is the third highest such ratio as of the end of March since 2000.
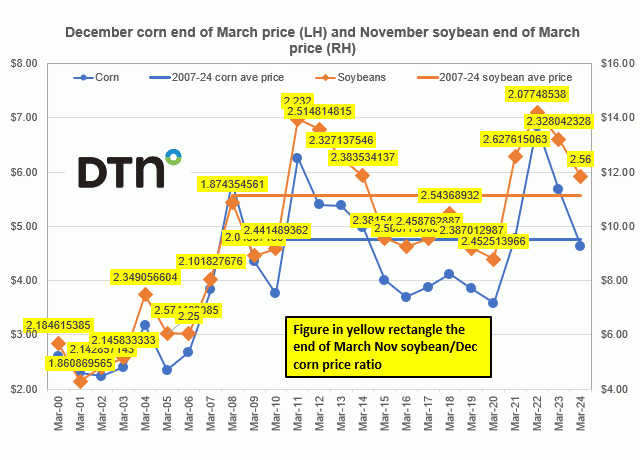
Along these lines, this chart shows the end of March December corn price on the left-hand axis along with the 2007-2024 end of March average Dec price of $4.76 while reported on the right-hand axis is the end of March November soybean price along with the 2007-2024 end of March average Nov price of $11.15.
The figure in yellow rectangle is the end of March Nov soybean/Dec corn price ratio.
As of the close of March 28, the current Dec corn value of $4.62 is the lowest end of March price for that contract month since 2021 as is the current November soybean price of $11.83.
Still, what could confirm USDA's larger soybean and lower corn projections than what trade is estimating is the fact again that the current SX/CZ ratio as of end of March at 2.56 is the third highest since 2000 as this year's ratio, other than a brief pop to the 2.57 in mid-November, is trading at highest levels since August of last year.
Also, the current November bean price is 6.0% above its 2007-2024 average value at this time of year while the corn value of 2.8% is below its respective 2007-2024 average.
(c) Copyright 2024 DTN, LLC. All rights reserved.


Comments
To comment, please Log In or Join our Community .