Fundamentally Speaking
USDA Corn, Soybean Yield Changes
USDA increased the 2022 U.S. corn and soybean yield by 0.4 bushels per acre (bpa) from the October to the November WASDE report to 172.3 and 50.2 respectively.
This is after lowering it from the August to September figures and then again in the October crop production report.
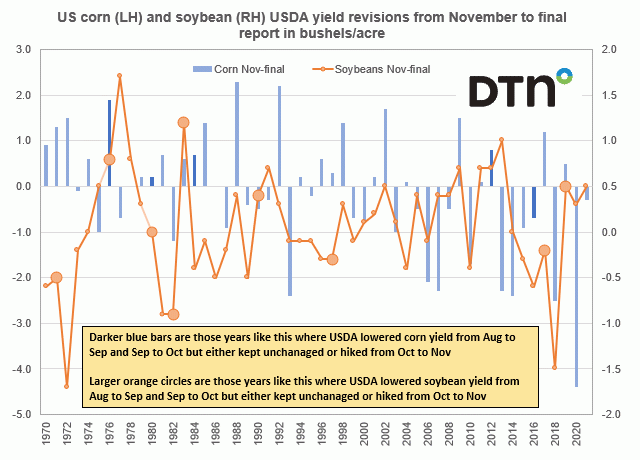
This chart shows the change for both the national corn and soybean yield from the November to the final report given in January from 1970 to 2021 with the corn revision on the left-hand axis and the soybean change on the right-hand axis.
In that time period, the average change for corn has been down 0.2 bpa and unchanged for soybeans.
In the six years since 1970 where USDA (like this year) lowered corn, the yield from August to September and then from September to October but either kept unchanged or hiked the yield from the October to November report, the change in yield averaged up 0.6 bpa as represented by the darker blue columns.
For soybeans, the average change in the nine occurrences of being down from August to September and September to October but either kept unchanged or hiked from October to November was up 0.1 bpa and are denoted by the larger orange circles.
(c) Copyright 2022 DTN, LLC. All rights reserved.
P[L1] D[0x0] M[300x250] OOP[F] ADUNIT[] T[]


Comments
To comment, please Log In or Join our Community .