Fundamentally Speaking
Percent Change for Key Commodities & Indicies
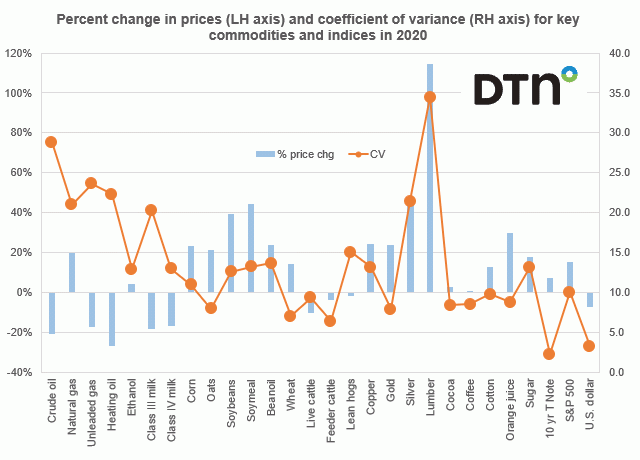
As we have done many times at the beginning of a new year, this graph provides a review of the price action for the key commodity and price indices for 2020 and the coefficient of variance figure.
The coefficient of variation (CV) is defined as the ratio of the standard deviation to the mean and this expresses the extent of variability in relation to the mean with higher figures denoting higher volatilities.
The biggest price gains and the most volatile market has been lumber where a huge housing surge along with record low interest rates and a boom in the repair and remodeling industries sent prices quadrupling from a four-year low in March of $250 per 1000 board foot to a record $1000 by the middle of September, only to see prices crash by half to $500 by the end of October but then values have soared back up, close to $900 by year end.
P[L1] D[0x0] M[300x250] OOP[F] ADUNIT[] T[]
Copper, another industrial commodity, also performed well as did the precious metals silver and gold.
The worst performer of the year was heating oil, down 27% for 2020 as the energy complex in general was a laggard this year based on the dampening impact the pandemic had on driving with many people working remote and foregoing their normal vacations.
The grain and oilseed markets were uniformly higher with the cumulative year-end gains topped by the percent recovery from ten year lows seen in both corn and soybeans at the beginning of August when there was serious talk of 2020/21 corn ending stocks topping 3.0 billion bushels and beans in excess of 800 million bushels.
The surge in feed prices and the drop in demand at away from home food service establishments resulted in general losses for the livestock complex while the softs markets other than orange juice has both moderate price changes and limited variability.
Despite the worst economic downturn since the Great Depression, the major equity markets posted impressive returns last year finishing 2020 at record-high levels with the S&P 500 index finishing 2020 with a gain of 16.3% for the year.
Meanwhile the dollar has been on a steady slide since the end of March, currently trading close to three-year lows and not far from breaching major support that could result in the greenback depreciating to levels not seen since late 2014.
(c) Copyright 2021 DTN, LLC. All rights reserved.


Comments
To comment, please Log In or Join our Community .