

Fundamentally Speaking
Trade Row Crop Yield Estimates
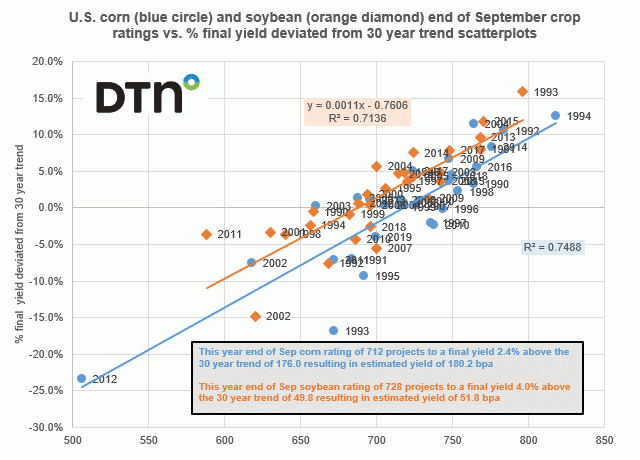
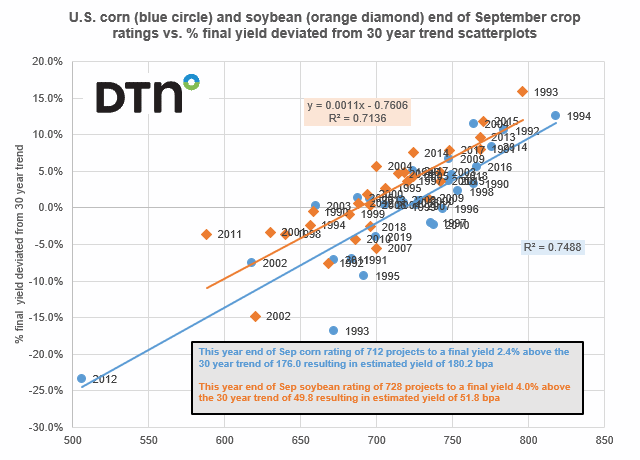
Similar to what we did at the end of August, in this chart we employ a simple regression model using U.S. corn and soybean crop ratings as of the end of September vs. the percent deviation from the 30-year trend yield to graph out a scatterplot study.
Using our usual rating system where we assign the percent of the crop in excellent condition at 10, that in good at 8, fair at 6, poor at 4 and very poor at 2 and then summing the results, the end of September corn rating of 712 projects to a final yield 2.4% above the 30 year trend of 176.0 bpa resulting in an estimated yield of 180.2 bpa.
P[L1] D[0x0] M[300x250] OOP[F] ADUNIT[] T[]
This year's end of September soybean rating of 728 projects to a final yield 4.0% above the 30-year trend of 49.8 resulting in estimated yield of 51.8 bpa.
We should note that the average trade estimate for Friday's crop production report is 177.7 bpa vs. USDA's last estimate of 178.5 bpa while average trade estimate for soybeans at 51.6 stands in contrast to USDA's September projection of 51.9 bpa.
There is probably some skepticism that current end of September crop ratings yields could be this high, but at least for soybeans in 2018, the 724 end of September crop rating resulted in final yields that season 7.5% above trend while in 2017 a 714 resulted in final yields 4.6% above trend.
For corn, the evidence is not as compelling as years where crop ratings at the end of September close to this year's 712 level such as 1999, 2006 and 2008 show yields closer to trend if not slightly above.
Note the r squared while decent does suggest some variability for both crops.
(c) Copyright 2020 DTN, LLC. All rights reserved.
Comments
To comment, please Log In or Join our Community .