

Fundamentally Speaking
Historical First USDA Soybean Crop Rating

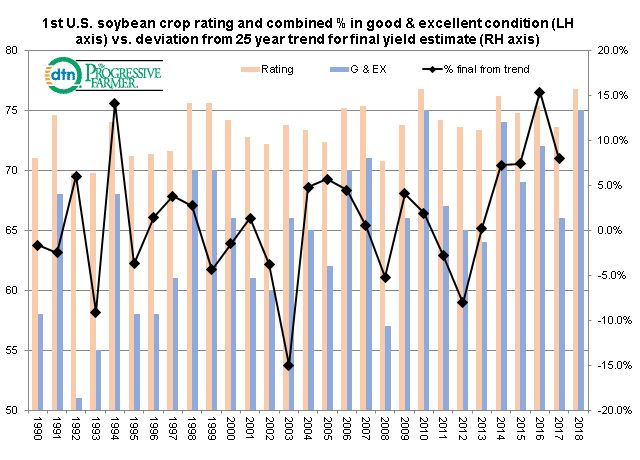
Similar to what we did with corn, this piece looks at the initial USDA weekly crop ratings for soybeans and compares that to the percent that final U.S. soybean yield deviated from the 30-year trend.
Employing our usual ratings system (where we weight the crop based on the percent in each category and assign that category a factor of 0.2 for very poor, 0.4 for poor, 0.6 for fair, 0.8 for good, and 1.0 for excellent and then sum the results), the first national soybean crop rating for 2018 comes in at 76.8 which, according to our records, ties 2010 as the best initial crop rating ever.
Also plotted on the left hand axis is the combined good and excellent ratings which this year total 75%, also equaling the all-time best seen in 2010.
As we had noted earlier, a strong start to the season is no guarantee that things will finish that way.
This graphic shows that in 2010, the national soybean yield was 1.9% above trend, a decent performance but certainly not in line with recent seasons that have seen U.S. soybean yields well above trend, even though the initial crop ratings of the year were well below those given for this year.
(KA)
P[L1] D[0x0] M[300x250] OOP[F] ADUNIT[] T[]
Comments
To comment, please Log In or Join our Community .