

Fundamentally Speaking
Change in USDA Wheat Stocks Estimates
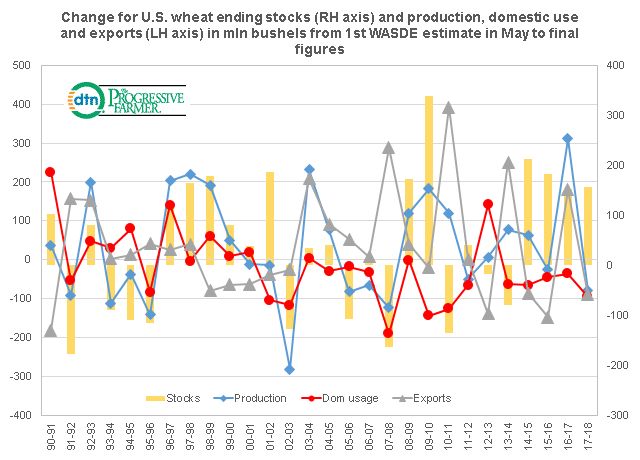
This is the final look at the change in ending stocks for the major U.S. crops from the first USDA balance sheet projections given in the May WASDE report to the final figures furnished 18 months later the following November.
This time we take a look at U.S. wheat with the change in ending stocks on the right hand axis and on the left hand axis we plot the 18 month change in exports, total domestic use and production, all in million bushels.
In prior posts we noted that large changes in final U.S. corn and soybean stocks from what had been projected 18 months earlier are most closely correlated with changes in production as output either higher or lower than what is initially forecast results in ending stocks either being higher or lower than originally estimated.
P[L1] D[0x0] M[300x250] OOP[F] ADUNIT[] T[]
This again is true for wheat as the change in stocks has a 58.2% correlation with the change in production though exports area close second with a negative 47.9% correlation.
From 1990 to 2017 the final USDA U.S. wheat stocks estimate has averaged 42 million bushels higher than first projected the prior May and this is due to production being 35 million bushels higher, total domestic demand (food-seed-feed) 18 million bushels less than first estimated and exports 36 million bushels higher.
One of the biggest negative revisions was in the 1991-92 season when final ending stocks came in 177 million bushels lower than had been projected in May 1991 due to production 91 million bushels less, domestic demand 53 million less but exports were 157 mln bushels higher.
The other largest negative revision was in the 2007/08 season where ending stocks were 163 million bushels less than first estimated based on production 123 million below what had first been estimated and an export figure 288 million bushels greater than was first projected.
On the other hand, in the biggest understatement of carryover stocks in the 2009/10 marketing year final stocks were a whopping 339 million bushels greater than first pegged in May 2009 with production 183 million bushels greater, domestic use 144 million less and exports 21 million lower.
As a final note, the USDA estimates on wheat ending stocks should be a little more accurate than those for corn and wheat since the USDA has already released the winter wheat seedings report and a good bit of new crop wheat export business has already been booked.
(KA)
© Copyright 2018 DTN/The Progressive Farmer. All rights reserved.

Comments
To comment, please Log In or Join our Community .