Fundamentally Speaking

South American Soybean Production

Joel Karlin
By  Joel Karlin , DTN Contributing Analyst

In a recent post I looked at the USDA track record of how well they peg U.S. corn and soybean production from their initial estimates given at their annual Ag Outlook Conference held in February to their final estimate in the following January as part of the annual crop production report.

Their track record is mixed though that is perfectly understandable as production is based on planted acreage, harvested acreage and yields with all three highly influenced by weather conditions.

We have done the same thing for the USDA's projection of South American soybean production, specifically output from Argentina and Brazil from the 2000/01 to 2014/15 marketing seasons.

P[L1] D[0x0] M[300x250] OOP[F] ADUNIT[] T[]

We measure production using data from the WASDE report which is the USDA's monthly world agricultural supply-demand estimates from their initial estimate of global oilseed production to their estimate for the same marketing year twelve months later.

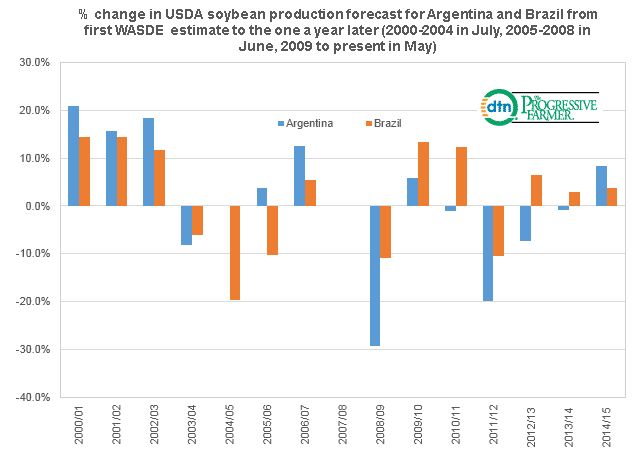
Note that up until 2005 the first WASDE South American soybean production estimates were given in July but that year the initial release was moved to June and in 2009 the first estimate was released in May, the same as the wheat and coarse grain projections.

This graphic shows some large deviations that were no doubt associated with particularly good or bad weather conditions in that growing season.

Over the past 15 years the USDA has understated the final Argentine soybean crop by as much as 20.9% back in the 2000/01 season while overstating final output by 29.2% in 2008/09.

The range is smaller for Brazil with an understatement of 14.5% in 2000/02 and the USDA overestimating the crop by 19.7% in 2004/05.

The average over the past 15 years has been for the USDA to understate the Argentine crop by 13.3% and the Brazilian crop by 10.6%.

(KA)

P[] D[728x170] M[320x75] OOP[F] ADUNIT[] T[]
P[L2] D[728x90] M[320x50] OOP[F] ADUNIT[] T[]

Comments

To comment, please Log In or Join our Community .

Roger Cooper
3/13/2016 | 12:25 PM CDT
Hey Joel ---- at least USDA seems to know alot about Brazil/Argentina. China is a loose cannon! You never know what they will pull next in order to buy cheaper!
Roger Cooper
3/13/2016 | 12:22 PM CDT
Wow! That is some great number crunchin' analysis! Good job Freeport! Great comparisons!
Freeport IL
3/7/2016 | 11:03 PM CST
The strong Dollar relative the Real increased the price of soybeans in Brazilian Real. The increased price pushed Brazilian production. The larger production resulted in a wider basis in South America that was required to move the extra production. The wider basis is what gives Brazil the advantage over the US. This might be important to appreciate. Later this marketing year the Dollar - Real price relationship might change. Some parts of the market view a strong dollar as an advantage for Brazil. So a weaker dollar, it might be thought, gives the US an advantage. This logic might have prices increase. If this occurs, after the Brazilian planting season, the export advantage should not change, for production should be known. The currency relationship will not change Brazilian growerâ?™s level of production. The basis and transportation cost will determine China's port of call. The following is the calculations that try to show this thesis. One cannot talk about soybean price without saying; "China". China imports about 25% (80.5 MMT) of the World's soybean production (320.5 MMT). The US produces about a third of the World soybean crop (107 MMT). We export about 55% of our production. Soybean meal is around 22% of the export amount and the beans are the balance. Brazil export around 77% of the production (100 MMT). Of those exports, about 74% is from the bean (57 MMT) and around 26% is in the meal form. Brazil accounts for about 31% of World soybean production. (For a comparison Argentina exports about 90% of the production. About 22% (11.8 MMT) goes out as beans and 78% as meal. Their production is about 18% (58.5 MMT) is the World.) The first of March, in 2015, the dollar could have purchased 3.06 Brazilian Real. Around the time March 2016 CME soybeans were trading about $9.67 per bushel. The Brazilian farmer would have seen the CME price as around $R29.59 real per bushel (3.06 X $9.67 = 29.59). (Their unit of sale is a sack which is 60 kilograms in weight or $R65.24 per sack. These calculations are confusing enough in bushels. So the next step of going to sacks has been mostly disregarded.) By planting time in Brazil, the dollar had strengthened against the Real to where now a dollar would have purchased 4.17 Real. March 2016 CME soybeans dropped about 8% to around $8.85 per bushel. Even with the drop in soybean price, the Brazilian farmer's price went up 24.7% to $R36.9 per bushel (4.17 X $8.85 = $R36.9) ($R81.3 per sack). To the US farmer that increase would be like seeing a price tag of $12.06 per bushel on the board. That is why Brazil's production is going up. The currency relationship pushed their price in their local currencies higher. Now with this extra production from higher local price and with about 77% of their production being export, the ports need to widen basis to move the larger production. It is this wider basis that provides a pricing advantage for Brazil not the currency relation. One dollar would have purchased 6.5 Chinese Yuan today and about 6.25 a year ago. If the March 2016 CME price is used, the board is about $8.75 today and $9.67 a year ago. To buy from the CME, the price in Yuan today would be about 56.88 Yuan per bushel ($8.75 X 6.5 Yuan/$ =56.88). A year ago it would have been 60.63 Yuan per bushel ($9.67 X 6.27=60.63). Today one Chinese Yuan buys about 0.58 Brazilian Real. A year ago it was .488 Real per Yuan. A year ago, as calculated above, $R29.59 was the value of a bushel of soybeans in Brazilian Real. That means, on the broad, the Chinese could buy a bushel of soybean through Brazil for 60.63 Yuan per bushel ($R29.59 Real per bushel/.488 Real per Yuan = 60.63 Yuan per bushel) through Brazil; the same as from the US. Today's price in Brazilian Real is $R32.99 ($8.75 X 3.77 Real per $ = $R32.99). The CME price to China through Brazil would be 56.88 Yuan per bushel ($R32.99 Real/Bu / .58 Real/Yuan = 56.88 Yuan per bushel). Again this is the same as through the US. The port of choice for China will then be the difference in the port basis and transportation cost. The level of production here and in Brazil will determine our and their basis at our ports. That and transportation cost will determine port of export. (As long as the newly signed BRICS (Brazil, Russian, India, China and South Africa) banking and currency relationships doesn't redirect traffic.)The currency relationships will not drive exports until it has another effect on production either here or there. Freeport, IL