
Fundamentally Speaking
1999-2016 USDA Ag Outlook Yield Est.
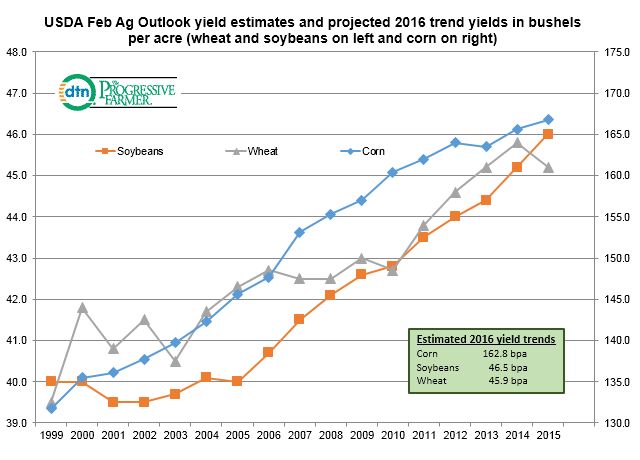
The USDA released their tentative yield estimates for the 2016/17 marketing year for the major crops at their annual Agricultural Outlook Forum meetings in the Washington DC area this past week.
They came at out at 168.0 bushels per acre (bpa) for corn, 46.7 bpa for soybeans and 45.9 bpa for wheat.
This chart shows the corn, soybean and wheat yields furnished by the USDA at their annual February Outlook since 1999.
Corn is on the right hand axis and soybeans and wheat are on the left hand axis, and based on trend calculations, these projections generally move higher each year.
If they are using a trend yield it is not the 1999-2015 trend for those numbers calculate to 162.8 bpa for corn, 46.5 bpa for soybeans and 45.9 bpa for wheat.
The biggest deviation is for corn and it appears that the USDA is using many more years mitigating the impact of 2012's disastrous 123.1 bpa figure. We note that this year's USDA corn yield is below the year ago 168.4 bpa figure and the 2014 171.0 bpa record.
Their soybean estimate is very close to the 46.5 bpa trend, though below the prior two years' of 47.5 bpa in 2014 and 48.0 bpa last year, both records.
As for wheat, the 45.9 bpa estimate is just above the calculated 1999-2015 trend yield of 45.7 bpa.
(KA)
P[L1] D[0x0] M[300x250] OOP[F] ADUNIT[] T[]

Comments
To comment, please Log In or Join our Community .