

Fundamentally Speaking
Change in Corn & Bean Stocks

This month's USDA 2015/15 U.S. soybean ending stocks figure was pared by 25 million bushels from the 475 million given in the September report.
This was linked to a 66 million bushel reduction in supply from beginning stocks 19 million lower and a 47 million bushel cut in this year's output as demand projections were actually pared by 40 million bushels.
P[L1] D[0x0] M[300x250] OOP[F] ADUNIT[] T[]
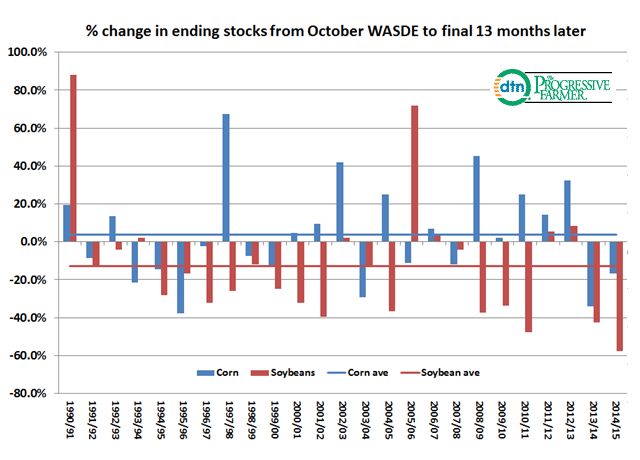
Even though the latest government projection is for the largest domestic soybean carryout and those stocks as a percent of consumption in ten years, the accompanying graphic shows the USDA has underestimated final soybean stocks relative to their October WASDE forecast by large margins in recent years, leading some to think the same thing will happen this year.
This chart shows the percent change in U.S. ending corn and soybean stocks from the October WASDE projection to the final ones issued 13 months later.
In fact last year's 450 million estimate made in the October 2014 WASDE was a whopping 58% above the final 2014/15 stocks of 191 million bushels, the largest miss at least in 25 years.
The chart does show that since 1990 the USDA in its October WASDE report has tended to understate final soybean demand by 15% while overstating corn usage by 5%.
The only caveat we can throw in there is expectations that the USDA will hike the 2015 corn and soybean yield estimates in the November and January crop reports leading to larger supplies and a still desultory demand picture.
(KA)
Comments
To comment, please Log In or Join our Community .