
Fundamentally Speaking
Effect of Heavy Spring Rains on KS & MO Soybean Yield

In a prior piece we talked about the slow pace of soybean seedings in the two most lagged states this year, Kansas and Missouri and what impact years of tardy plantings have on acreage as measured from the March intentions to the figures contained in the final crop production report.
Since both are further south than some of the other major producing states and have final planting dates anywhere from June 25 to the 30th, even in years where wet weather has resulted in a very delayed pace of seedings final acreage has in the past not fallen too much from what was indicated in the March prospective plantings report.
The heavy rains that have caused severe planting delays with 57% of the KS soybean crop seeded as of this past Sunday, 28% behind the average pace and 42% of the MO crop in the ground, 43% below average are also thought to be negative to yields.
P[L1] D[0x0] M[300x250] OOP[F] ADUNIT[] T[]
This is based on ponding issues and fertilizer and other nutrients leaching away.
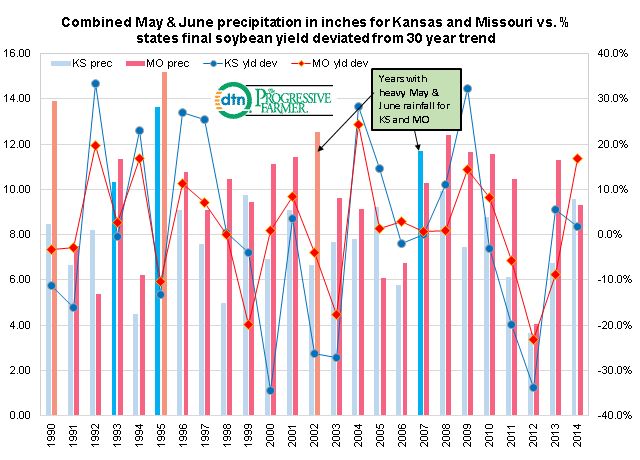
This piece shows the combined May and June precipitation in inches from 1990 to 2014 and the percent that each states final soybean yield deviated from the 30 year trend.
On the graphic we singled out the three wettest May-June periods for each state which we classified as the average rainfall plus one standard deviation and for KS this was a combined 10.32 inches and for MO it was 12.12 inches and these years are marked by different shades of blue for KS and red for MO.
For Kansas, the three wet years were 1993 with 10.32 inches of rains yet trend yields were attained that season, 1995 that had the highest amount of May-June precipitation of 13.63 inches that contributed to final soybean yields that year 13.2% below trend and finally 2007 where 11.67 inches of rain also resulted in trend yields.
For MO the wet years were 1990 where 13.88 inches of rain had final yields 3.4% below trend, also 1995 where like KS the most rains fell at 15.18 inches leading to final soybean yields 10.3% below trend and 2002 where 12.55 inches of rain resulted in final yields 4.1% below trend.
It does appear that for both states especially MO heavy May and June rains do have a depressing impact on yields.
Though we do not have the June 2015 rainfall totals yet May precipitation in KS was 8.15 inches, the highest since 8.79 in 1995 and 7.18 inches in MO, the highest since 9.78 inches also in 1995.
Given the copious amount of moisture both states have received so far this month it appears that both states will have May-June precipitation in amounts to qualify as a wet year implying below trend soybean yields for each.
(KA)
Comments
To comment, please Log In or Join our Community .