

Fundamentally Speaking
Dec 2015 vs. Dec 2010 Corn

There has been a steady drumbeat of bearish news over the past few weeks as corn values continue to recede pressured by waning export demand linked to abundant and cheaper South American supplies.
On the domestic front, confirmation of an outbreak of avian flu at a large layer facility in Iowa along with those already incurred in numerous turkey flocks accentuates an already soft feed demand outlook.
A final bearish factor is a generally favorable start to the 2015 growing season for though the latest crop planting progress showed seedings behind schedule a week of open weather after good rains this past weekend should result in at least half the nation’s intended corn crop in the ground as of May 2nd.
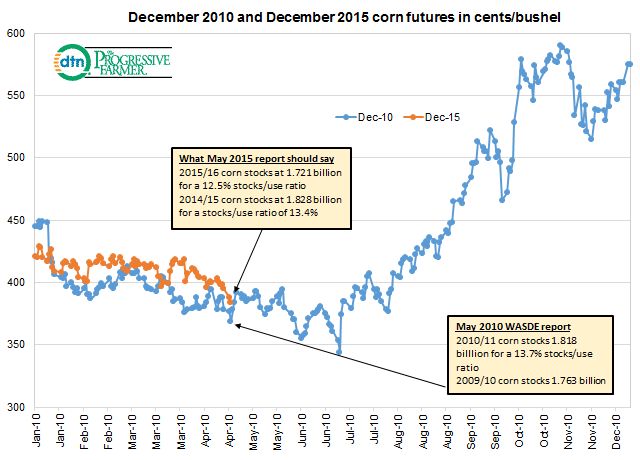
The accompanying graphic tracks this year’s December corn futures contract and also the December 2010 corn futures as there has been talk of how market action this year has mirrored price activity five years ago.
The December 2010 contract made a low at $3.56 on 9/14/09 when the 2009 record corn harvest was in full swing.
From there a post-harvest rally ensued that lasted till 1/11/10 with the high at $4.49 per bushel, a 26% rally since the harvest low.
P[L1] D[0x0] M[300x250] OOP[F] ADUNIT[] T[]
From there prices set back all through the winter and spring with a new low set at $3.45 per bushel on 6/29/10, a 23.2% decline.
From there prices rallied helped by a bullishly construed June 1 quarterly stocks and June Acreage figures.
Values continued to rally into the fall aided by a crop that came in well below expectations.
Similarly, this year’s December corn futures contract made a low of $3.65 on 10/1/14, also in the wake of a record corn harvest.
A post-harvest rally carried futures to a high of $4.40 per bushel by 12/29/14, a 21% increase.
From that point prices have moved lower and a decline similar in magnitude to the 23% decline seen in the December 2010 contract would project December 2015 futures to a low of $3.38 vs. today’s low of $3.83.
It is interesting to note that the first USDA estimate of the 2010/11 balance sheet issued in May 2010 pegged new crop corn stocks at 1.818 billion bushels at a 13.7% stocks to use ratio.
When the USDA issues its first WASDE report for the 2015/16 season we are looking for an ending stocks figure of 1.721 billion bushels resulting in a stocks-to-use ratio of 12.5%.
The final point of comparison is back in May 2010, the USDA pegged old crop corn stocks at 1.763 billion bushels resulting in a stocks-to-use ratio of 13.5%.
The latest WASDE report puts this year’s ending stocks at 1.828 billion bushels with a stocks-to-use ratio of 13.4%.
Though we have never been big fans of analog year studies, the similar price action seen so far this year along with very close stock to use ratio figures merit some attention.
(KA)
© Copyright 2015 DTN/The Progressive Farmer. All rights reserved.
Comments
To comment, please Log In or Join our Community .