
Fundamentally Speaking
Soybean Acreage Changes in Top States

U.S. soybean plantings last year set a new record at 83.7 million acres as for the first time in years, returns for that crop exceeded those for corn for many producers.
This year for most Midwest farmers, planting corn will be even a bigger loser relative to soybeans with trade expectations of another 1-3 million increase in domestic soybean acreage.
P[L1] D[0x0] M[300x250] OOP[F] ADUNIT[] T[]
The 2015 planted area could be even larger given that in five of the past seven seasons, the final soybean acreage has exceeded the March intentions figure by an average of 1.90 million acres.
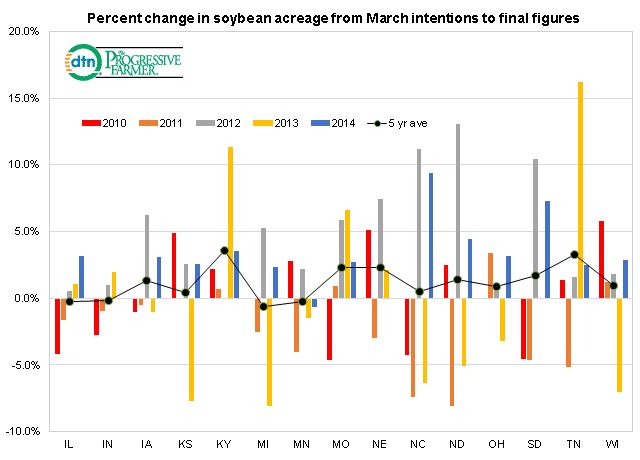
Similar to what we did with corn in an earlier piece, the accompanying graphic shows the percent change of soybean planted acreage from the March intentions report to the final figures for the top 15 producing states of both corn and soybeans for each year from 2010 to 2014 along with the five year average.
With U.S. corn acreage falling in four of the past five years from the March intentions to the final acreage figures, we assume that the cold and wet springs in the Upper Midwest that resulted in some intended corn acreage not getting planted could have instead been switched to soybeans.
The chart does show that some Upper Midwest states have seen final soybean planted area increase from the March number with the five year average percent change up 1.4% in both Iowa and North Dakota and up 1.7% in South Dakota.
Actually the largest increases are in two of the more southern states, TN and KY where soybean plantings have increased in recent years in that region of the country along with more minor producing states at the expense of more traditional crops that have been down in that area such as cotton, peanuts and tobacco.
(KA)
© Copyright 2015 DTN/The Progressive Farmer. All rights reserved.
Comments
To comment, please Log In or Join our Community .