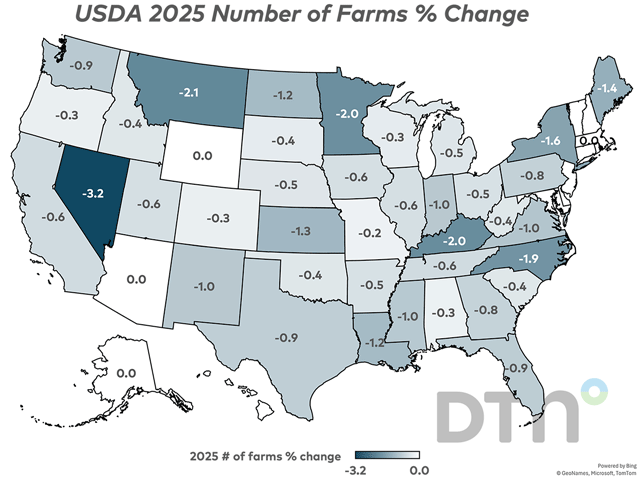

Fundamentally Speaking
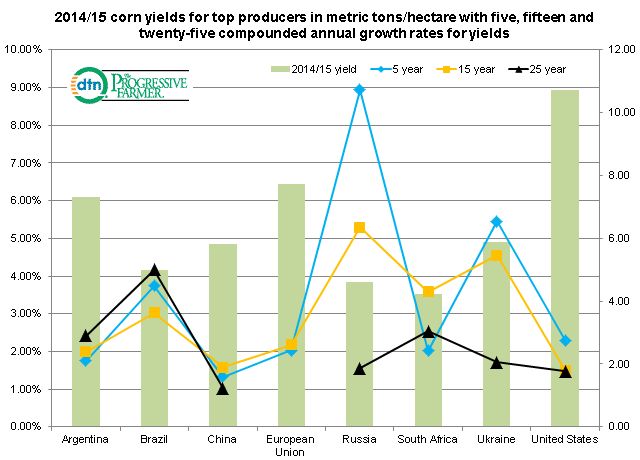
Corn Yields & Growth for Top Producers

Continuing with our series on how U.S. yields of major crops compare with those overseas, this graphic shows corn yields for some of the world's major producers.
Similar to what we did with wheat, corn yields this past year for eight of the top producing countries or regions are reported in metric tons per hectare (MT/ha).
The five, fifteen and twenty-five year compounded annual growth rates (CAGR) for each time period are also plotted.
P[L1] D[0x0] M[300x250] OOP[F] ADUNIT[] T[]
The U.S. has the highest corn yields by far and even in 2012 when this country suffered one of its worst droughts in history our corn yields albeit the lowest since 1995 still topped all other producers.
The only countries that come close are France and Italy though their figures are incorporated into the larger European Union number beginning in the 1999/2000 season so there is no 25 year CAGR for EU corn yields.
Even with the very poor 2012 results, the 5 year CAGR for U.S. corn yields is higher than the 15 year CAGR which in turn is above the 25 year CAGR due in part to this past year's record yield.
Of particular note is the rapid increase in Russian and Ukrainian corn yields in recent years, important in that each has emerged as a formidable competitor with the U.S. in the global trade arena along with Brazil and Argentina.
We also bring your attention to lagged Chinese corn yields due to their refusal to seed the higher yielding GMO varieties and severe air and water pollution.
This has been offset however by large acreage allotted to corn and hefty subsidies paid to farmers to produce this crop as Chinese policymakers continue to encourage the domestic production of grain and cereal crops and the importation of oilseeds and products.
(KA)
Comments
To comment, please Log In or Join our Community .