

Fundamentally Speaking
July Temps in IA & IL Following "Wet" June
Despite heavy and in some cases record amounts of rain in sections of the Northwest Corn Belt, the markets have had a very blasé response.
One reason is this copious amount of moisture has come in the very area that has had long-standing subsoil moisture deficiencies and the latest U.S. Drought Monitor map shows almost no drought now in the Midwest.
Another consideration is the common thought that for every area suffering from excess precipitation, nine are benefiting.
Finally, we have heard comments indicating that all this moisture in the ground will help limit increases in temperatures as we head into the hottest part of the summer.
P[L1] D[0x0] M[300x250] OOP[F] ADUNIT[] T[]
We were curious whether this last statement is true to we looked at Illinois and Iowa July temperatures following a "wet" June.
Our classification of a wet June was readings one standard deviation above the average 1950-2013 June precipitation for both Illinois and Iowa.
The average 1950-2013 Iowa June rainfall is 4.72 inches with the standard deviation 1.77 so a wet June is one where rainfall is 6.49 inches or higher.
For Illinois, the average 1950-2013 June precipitation is 4.19 inches with a standard deviation of 1.58 so a wet June there would be 5.76 inches or higher.
Since 1950 there were none wet June's for Iowa and 12 wet Junes for Illinois.
These were plotted vs. the July temperature for those years in degrees Fahrenheit.
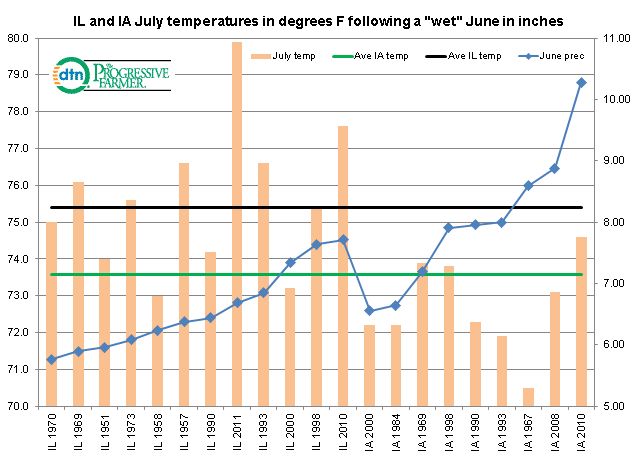
The accompanying graphic shows that there have been many seasons where a wet June is followed up by a hot July.
In Illinois, the average 1950-2013 July temperature has been 75.4 degrees but the average July reading in the 12 wet years has been 75.8 degrees.
For Iowa, the 1950-2013 July average temperature is 73.6 degrees with a 72.8 reading in the nine wet years, so not much of a difference.
Also one of the wettest Junes ever in Iowa was in 2010 with 10.28 inches of rain yet Iowa July temperatures that year averaged a very warm 74.6 degrees.
There are many benefits to heavy June rains but capping July temperatures does not appear to be one of them.
(KA)

Comments
To comment, please Log In or Join our Community .