

Fundamentally Speaking
Weekly Ethanol Production vs Estimated Plant Margins
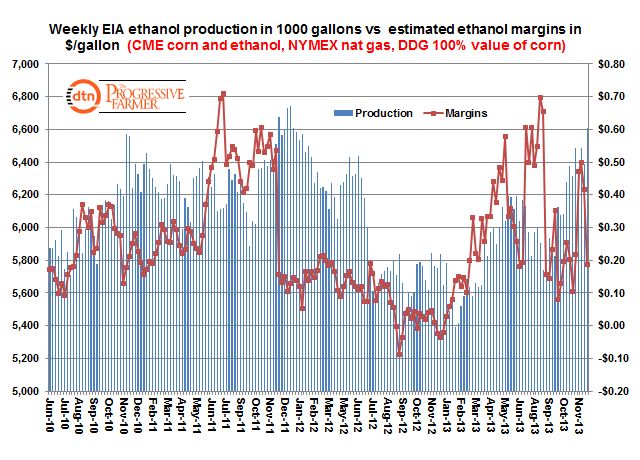
Last week, the USDA referenced the recent strong pace of production as reason for hiking its annual corn used for ethanol projection by 50 million bushels.
Output on a weekly basis has risen over the past few months and by early December approached 6.5 million gallons being produced, the highest in close to two years.
P[L1] D[0x0] M[300x250] OOP[F] ADUNIT[] T[]
This increase in output has been spurred by the huge drop in corn prices with spot futures the lowest in over 40 months and until recently strong ethanol prices.
Actually, the outlook for ethanol has clouded over the past month with the EPA announcing a rollback in the government mandate that may lower annual output to 4.80 billion bushels vs. the new 4.950 billion estimate.
This past week, ten senators unveiled a bill for the complete elimination of the ethanol mandate and though its passage seems unlikely, the combination of these two has pummeled ethanol prices over the past two weeks.
The accompanying chart shows the Energy Information Agency (EIA) weekly ethanol production is 1000 gallons vs. the estimated weekly ethanol margins in $ per gallon.
This estimate is something we calculated based on the weekly CME corn and ethanol price, NYMEX natural gas values, other costs, and assuming the price of distillers dried grains (DDG) is 100% the value of corn.
Actually, the price of DDG relative to corn has really spiked given the surge in protein meal values and due to the huge export demand to China.
The DDG/corn ratio has recently approached the 140% level suggesting that our calculated ethanol margin is lower than actual plant returns.
Note that January 2014 ethanol futures, valued as high as $2.50 per gallon at the beginning of the month has collapsed to $1.77 in recent sessions.
(KA)

Comments
To comment, please Log In or Join our Community .