

Fundamentally Speaking
Seasonal Changes in Soybean Crop Conditions

A steady decline in U.S. soybean crop conditions over the past six weeks has the trade lowering their projections for the 2013 yield, last estimated by the USDA at 42.6 bushels per acre (bpa).
The very dry weather over much of the Corn Belt is primarily responsible with a recent spate of well above average temperatures accentuating the dryness at a time when the soybeans are setting and filling pods.
P[L1] D[0x0] M[300x250] OOP[F] ADUNIT[] T[]
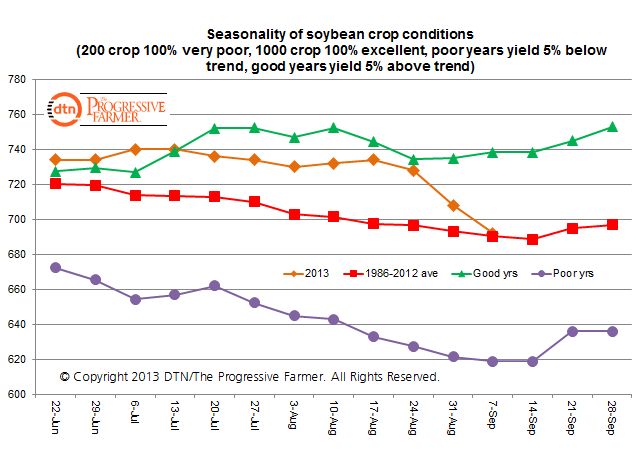
Using our usual ranking system where we weight the crop based on the percent in each category and assign that category a factor of 2 for VP, 4 for P, 6 for F, 8 for G, and 10 for EX and sum the results, this year’s September 1 rating was 692.
This is just about at the 1986-2012 average of 691 and equal to the 2011 yield at this time of year that resulted in a final U.S. soybean yield of 41.9 bpa, a number that seems higher than what the market is trading today.
Crop conditions for a variety of reasons usually decline as the growing season progresses though in some years they actually go up.
This graphic shows soybean crop condition from weeks 25 through 39, roughly corresponding to the third week in June to the first week in September for 2013, the 1986-2012 average, poor years where final yields are 5% or more below trend and good years where final yields are 5% or more above trend.
This year the crop ratings declined by 5.7% between June 22 and September 1 and that is a larger decline for that time span than seen for the 1986-2012 average of 4.1%.
In good years, the rating averages a 1.5% increase while bad years show an 8.0% decline.
(KA)
Comments
To comment, please Log In or Join our Community .