
Fundamentally Speaking
Spring Wheat Seedings vs. Planted Acreage Changes

U.S. spring wheat seedings made good progress last week, up 20% with 43% now in the ground as of May 12.
This is still below the 92% pace a year ago and the five year average of 63%.
With the clock ticking, we were curious as to what impact late plantings had on the amount of spring wheat that actually gets planted.
P[L1] D[0x0] M[300x250] OOP[F] ADUNIT[] T[]
The 1985-2012 average pace of spring wheat seedings as of May 12 is 69% with the standard deviation during that period 21%.
We then would classify late years as the average minus one standard deviation or 48%.
From 1985 to 2012 there were six years when spring wheat seedings were 48% or lower as of May 12 including three years in a row from 1995-1997.
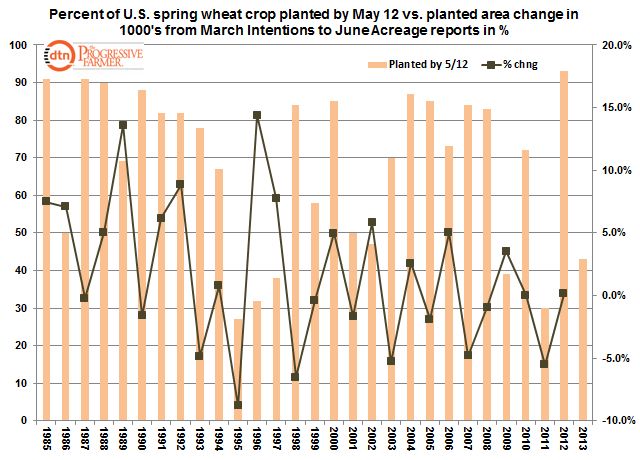
The accompanying graphic shows the percent of spring wheat seeded as of May 12 vs. the percent change in planted acreage from the March Prospective Plantings report to the June Acreage numbers.
A look at the data shows the two latest planting years having a drop in acreage from March to June.
This would be 1995 when plantings as of May 12 were 27% and the March to June acreage decline was 8.8% and 2011 when 30% of the crop was seeded by this date and acreage fell by 5.5%.
Other slow years saw acreage increases including 1996 with 32% yet acreage rose by 14.4%, 1997 with 38% in the ground yet planted area increased by 7.8%, and 2009 with 39% planted yet seedings rose by 3.5%.
The average planting pace for all six slow years is 36% yet the average acreage change from the March to June report is up 2.9%.
This is just below the average for all four of the fast planting years (May 12 seeding pace of 90% or higher) where acreage increased by an average of 3.1%.
(KA)
Comments
To comment, please Log In or Join our Community .