
Fundamentally Speaking
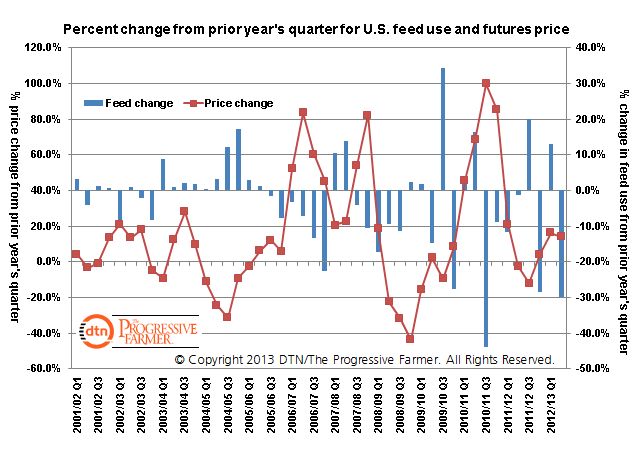
Percent Changes in Quarterly Corn Feed Demand & Prices
Once again, a USDA quarterly stocks report has roiled the corn market, this time to the downside with the number coming in close to 400 million bushels above the average trade guess for the March 1 inventory.
This is a reversal from the January 11th report that showed December 1 corn stocks over 200 million bushels below the consensus estimate.
That figure implied Sep-Nov 2012 feed use 13% above the corresponding quarter the year prior that on the surface seemed puzzling given lower grain consuming animal unit numbers and corn futures values that were 16.3% higher than what was seen in the Sep-Nov 2011 period.
P[L1] D[0x0] M[300x250] OOP[F] ADUNIT[] T[]
This new data now suggests feed demand is much lower than had been projected with implied usage in the just completed Dec-Feb period off 30% from the prior year.
This graphic shows the percent change for both quarterly corn feed use and corn futures prices from the similar period the year prior.
With industrial and export demand for U.S. corn being reported on a regular basis, it really is the feed component that is unknown when trying to calculate the quarterly stocks figure and is actually backed into.
Certainly, these stock figures have attracted a lot of notoriety highlighting the USDA’s antiquated feed demand model and creating more uncertainty about how the proliferation of byproducts are making calculation of exactly how much corn is being fed very complicated.
This graphic does show that feed demand as a percent of the prior year has become much more volatile.
Prior to 2008, it appears that if feed demand for a particular year was higher for the Sep-Nov period than the prior year that pattern would carry on through the rest of the year for the Dec-Feb, Mar-May, and Jun-Aug quarters and the same if demand were down.
Over the past five years, it seems more common to see implied feed usage up then down and back and forth this way through the marketing year.
Even though the more volatile corn prices relative to the year earlier may be responsible for part of this pattern, price variability seems to have had less impact prior to 2008 where quarterly feed use compared to the year prior period rarely exceeded up or down 10%.
(KA)

Comments
To comment, please Log In or Join our Community .