Fundamentally Speaking

History of Sep-Dec Corn Spread vs. Aug Stocks-to-Use Ratio

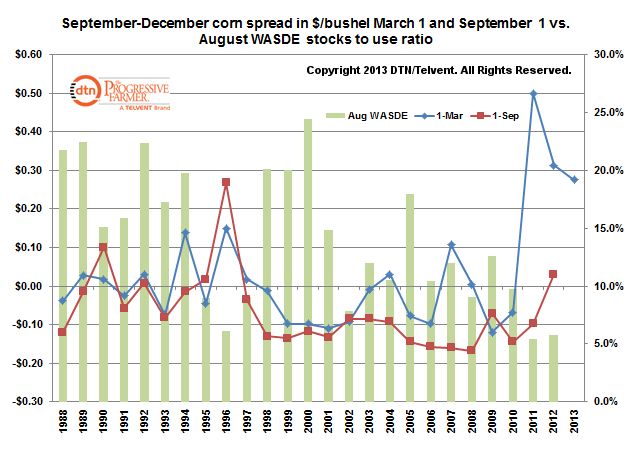
The 2013 September-December corn spread as of March 1 came in at $0.2750 premium to the September contract and that appears to be the third highest inverse ever next to the $0.3125 spread last year and the peak of a $0.50 inverse back on March 1, 2011 for the Sep-Dec 2011 spread.

It is interesting that the prior two years have seen a higher inverse even though the latest stocks to use ratio is the tightest ever.

The prior peak was seen back on March 1, 1996 at $0.15 for the Sep-Dec 1996 spread, a year very similar to now with the stocks to use also very tight back then.

We were curious what this spread did over the next six months and were values after the August WASDE report which is when the first survey based crop production report is released.

P[L1] D[0x0] M[300x250] OOP[F] ADUNIT[] T[]

This chart shows the September-December corn spread as of March 1 and September 1 and plots the August corn stocks to use ratio.

Keep in mind that while December is a new crop month, September is both for some early harvested corn can be delivered against the September contract especially if some early corn is available out of the Southeast and/or the southern Midwest harvest is particularly early.

On the other hand, a late start to plantings, a cool summer that prolongs the developmental process and the accumulation of growing degree days can have the September act more like a new crop contract.

Usually the Sep-Dec spread narrows in the six months between March 1 and September 1 for month times the new crop production is normal and there is less demand for the higher priced September.

Actually this spread seems to narrow whether the crop is large or small.

Last year, one of the worst droughts in history saw the spread narrow by $0.2825 and the season prior to that, also a short crop year saw the spread tumble by $0.60 per bushel and even in 1988 it lost $0.0825.

On the other hand, record crops such as seen in 1994 and 2004 also saw the spread narrow.

It appears that the spread widens when the crop is late making the September corn all the more valuable.

Such was the case in 2009, 2002, and 1995, all late harvest years.

With talk of large plantings in the south and demand remaining poor, the odds seem right that the spread between the September and December 2013 crops will be quite a bit narrower than the currently high 27 cent spread.

(KA)

P[] D[728x170] M[320x75] OOP[F] ADUNIT[] T[]
P[L2] D[728x90] M[320x50] OOP[F] ADUNIT[] T[]

Comments

To comment, please Log In or Join our Community .

Freeport IL
3/12/2013 | 12:56 AM CDT
This is the bullish argument for increased 2013-14 corn demand. CME Light Sweet Crude Oil is trading in the $89 per barrel price or better for the time period equal to 2013-14 corn marketing year for (September 2013 through August 2014). Fuel blenders throughout the World should be aggressive buyers of ethanol when they net more from ethanol than crude. Our crude model (pun intended) has a relationship, when back into a corn price, that looks something like this: corn at $7.00 per bushel ethanol blending aggressively occurs when crude is above $96 per barrel, $6.50; $90, $6.00; $85, $5.50; $80 and $5.00; $75. The current crude future is around $90 per barrel for the 2013-13 corn marketing year. This would indicate corn would have to roughly move above $6.50 per bushel in 2013-14 before aggressive purchases would end. The December 2013 CME corn future is around $5.50 per bushel. This would indicate aggressive ethanol purchases would occur until crude oil goes below $80 per barrel. An aggressive worldwide ethanol market could have US ethanol producers back using 5,000 million bushels of corn. This is 350 million bushels higher than USDAâ?™s early estimate. Non-USA Worldwide use of corn could grow just over 4% next year. (This growth rate or better has occurred in 5 of the last 12 years. In 2012-13 world corn use declined 2.7%. The last prior decline occurred in 2008-09. That year corn consumption was down 2.6%. The next year, 2009-10, non-US World use increased 4.5%.) If non-USA World corn production comes in at 602 million metric tons (4% larger than this year's (2012-13) record production of 580 million metric tons), consumption is around trend line and ending stocks experiences a minimal drop, then US corn could find a home for 2 billion bushel outside the country. This projection is 500 million bushel over USDA's early estimate. Using these projections, corn use for 2013-14 could be 13,860 million bushel. This is at the upper limits of US corn usage and 850 million bushels higher than USDA's preliminary estimates. USDA's first official look at 2013-14 will be in the May 2013 WASDE report. There are many"short comings" when trying to incorporate a larger usage, than USDA's, into one's marketing plan. First is the demand may not materialize. A strong dollar and weak energy demand could push crude oil prices lower than projected. Foreign production could have a huge jump. Year to year changes in non-US production has increase more than 12% in the past. (That increase occurred when general price levels were increasing strongly but could occur anytime.) Foreign demand for US corn could move lower than expected because of currency relationship, political reasons or maybe just no need (bad estimates). Price movement will not occur until the market reasonably believes; the extra demand is there. This might require going deep into a marketing year and risk "passing up" good price for something that may not occur or occurs too late. The last challenge is the old "catch all"; all other things known and known that could cause things to go bad - Murphy's Law with St. Patty's Day coming. The "take a ways" from this discussion- that this time- is sub $5.00 corn futures seems unlike but if it occurs, 2014-15 (two years out) may not be as bad as the numbers would indicate. Freeport, IL