

Fundamentally Speaking
Correlation of Various Weather Related Variables to Iowa Corn Yields

There continues to be quite a bit if discussion about the USDA’s projected U.S. corn and soybean yields given at their annual Agricultural Outlook Conference Feb 21-22.
The corn yield is estimated at 163.6 bushels per acre, up 40.2 from last year and if achieved would be the second highest corn yield on record next to the 164.7 bpa seen in 2009.
P[L1] D[0x0] M[300x250] OOP[F] ADUNIT[] T[]
The soybean yield is put at 44.5 bpa, up 4.9 from last year’s drought reduced crop and this would be a new record, surpassing the 44.0 level also seen in 2009.
As mentioned in prior pieces, the USDA has developed a new yield model for corn that uses planting progress as of mid-May, June precipitation only if it exceptionally low, and temperatures and precipitation for July.
What is interesting is that most of these explanatory variables; mid-May plantings, June precipitation, and July temperatures have a constant or linear impact on yields while July precipitation has an asymmetric or non-linear impact.
We will be talking this up in a future piece, attempting to replicate the USDA model but for now, we were interested in which weather related factors have the highest correlation to the percent that Iowa corn yields deviate from trend.
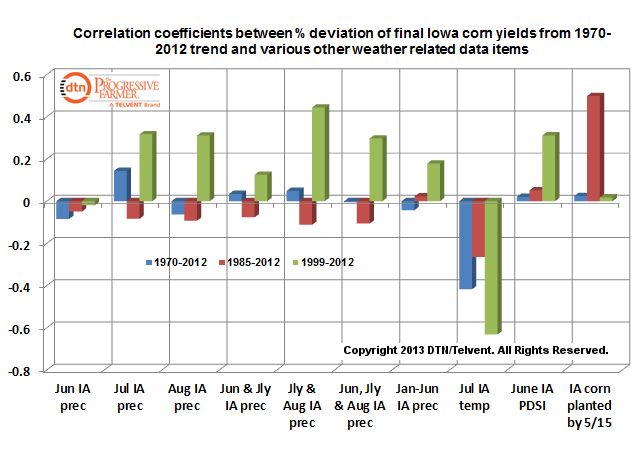
The accompanying graphic shows the correlation coefficients between the percent deviation that final Iowa corn yields deviated from the 1970-2012 trend and June Iowa precipitation, July Iowa precipitation, August Iowa precipitation, combined June & July precipitation, combined July & August precipitation, and combined June, July, & August precipitation.
Other variables included January-June combined Iowa precipitation, July Iowa temperatures, the end of June Iowa Palmer Drought Severity Index (PDSI), and the percent of Iowa’s corn crop planted by May 15.
These are plotted for a 42 year, 28, and 14 year period. Some of the correlation coefficients have changed depending on whether a 42, 28, or 14 year time period is used but it appears that in the more recent period (1999-2012) July Iowa temperatures and combined July and August precipitation had the most influence followed up by the end of June PDSI.
We find it interesting that in the 1985-2012 period mid-May plantings had a very large correlation that was unmatched in the other two periods and that may be due to some very slow planting years in 1993 and 1995.
(KA)
Comments
To comment, please Log In or Join our Community .