

Fundamentally Speaking
June-Oct Precipitation in Top Corn & Bean States

After weeks of improvement, the latest Drought Monitor update indicated that as of last week, 60.1% of the lower 48 states were in some form of drought, up from 58.8% the prior week with the area in the worst two categories, extreme or exceptional rising from 18.3 to 19.04%.
This comes at a time when U.S. winter wheat conditions are at their worst point for this time of year since the USDA started tracking crop ratings back in 1986.
Meanwhile, there is a lot of controversy about how to deal with extremely low water levels on the nation’s main riverways, also directly attributable to this year’s drought.
P[L1] D[0x0] M[300x250] OOP[F] ADUNIT[] T[]
Given this situation were curious as to which of the key growing states was most deficient in moisture.
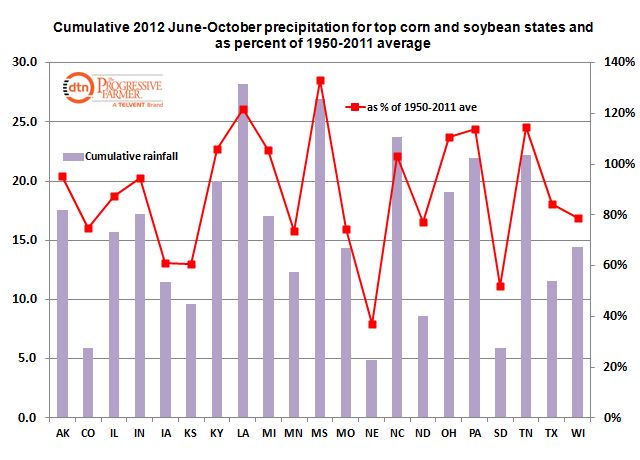
This graphic shows the cumulative June-October precipitation for the top 21 corn and soybean growing states and that moisture as a percent of the 1950-2011 average.
The state that is in the more dire condition is Nebraska where the June-Oct rainfall of less than five inches is a mere 37% of the 13.3 inches they normally receive over this time.
Other states with severe deficiencies in moisture include SD at 51.9% of normal, KS at 60.7% and IA at 61.1%.
On the other hand, the Delta states have fared very well resulting in many record corn and soybean yields for this region of the country.
MS leads the way at 133% of normal June-Oct rains followed up by LA at 121%, and TN at 115%.
States in the Eastern Corn Belt that had moisture deficiencies at mid-year have also seen a vast improvement with PA at 114% and OH at 111%, though the Western Corn Belt remains much drier.
Needless to say, those states that have received 80% or less of normal rainfall will have to be monitored in the coming months ahead of 2013 row crop plantings.
(KA)
Comments
To comment, please Log In or Join our Community .