

Canada Markets
Commercial Canola Stocks Tighten

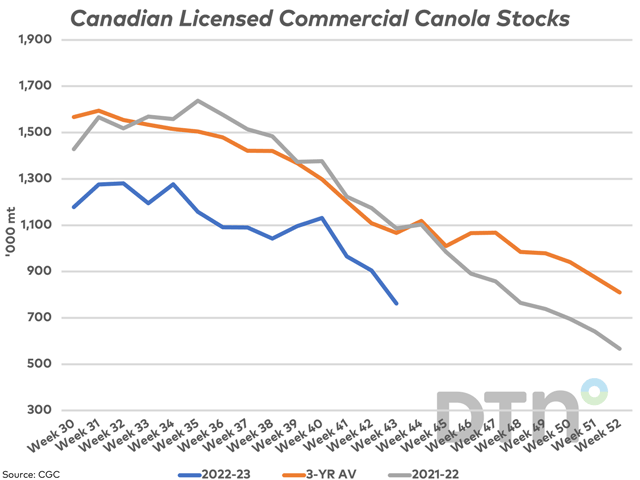
The Canadian Grain Commission reported commercial stocks of canola in store licensed facilities falling for a third consecutive week to 762,000 metric tons (mt) in week 43 or the week ending May 28, as shown by the blue line on the attached graphic. This volume is down 30% from the same week in 2021-22 and 28.5% below the three-year average for this week. This is the lowest stocks reported for this week in six years.
Stocks are expected to tighten. AAFC's May supply and demand estimates pointed to a lower revision for 2022-23 canola ending stocks from 1 million metric tons (mmt) to 650,000 mt, down from 865,000 mt estimated for July 31, 2022, and would be a fourth consecutive drop. At 650,000 mt, stocks would be the lowest since 588,000 mt was estimated in 2012-13, or 10 years.
P[L1] D[0x0] M[300x250] OOP[F] ADUNIT[] T[]
The week 43 Grain Statistics Weekly provides a reminder that demand is alive and well, with 186,700 mt of exports reported by the Canadian Grain Commission as well as 202,900 mt of domestic disappearance, or 389,600 mt in total for the highest weekly volume reported in six weeks. Demand for both exports and domestic disappearance for the week was above the volume needed this week to reach AAFC's current demand forecast, while cumulative disappearance over 43 weeks is currently 414,050 mt ahead of the steady pace needed to reach AAFC's current forecast.
As seen on the attached chart, commercial stocks tend to drift lower over the balance of the crop year, or through the end of July. The three-year average shows a 24% drop in commercial stocks from week 43 to week 52. In 2019-20, stocks rose 37.5% over this period, while falling 46%-48% in 2020-21 and 2021-22.
The relationship between commercial stocks to total stocks as of July 31 is highly variable, according to past Statistics Canada stocks estimates. On July 31, 2022, stocks in commercial facilities accounted for 73% of total stocks, while over 10 years, this is calculated to range from a low of 27% to a high of 73%. The five-year average is 42.8% and the 10-year average is 49.3%.
Cliff Jamieson can be reached at cliff.jamieson@dtn.com
Follow him on Twitter @Cliff Jamieson
(c) Copyright 2023 DTN, LLC. All rights reserved.
Comments
To comment, please Log In or Join our Community .