Canada Markets
November Canola Technical Signals
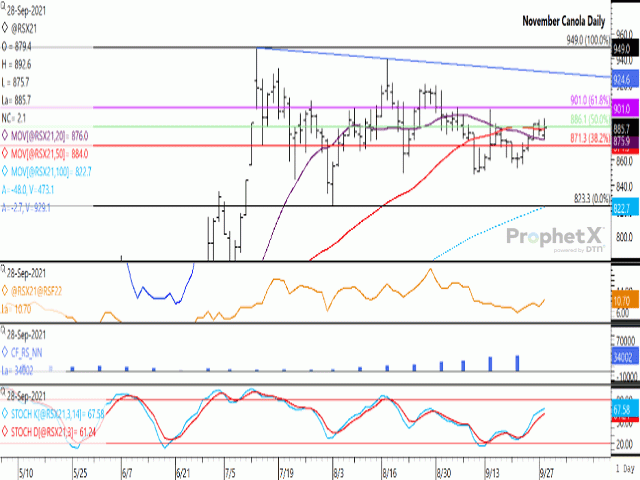
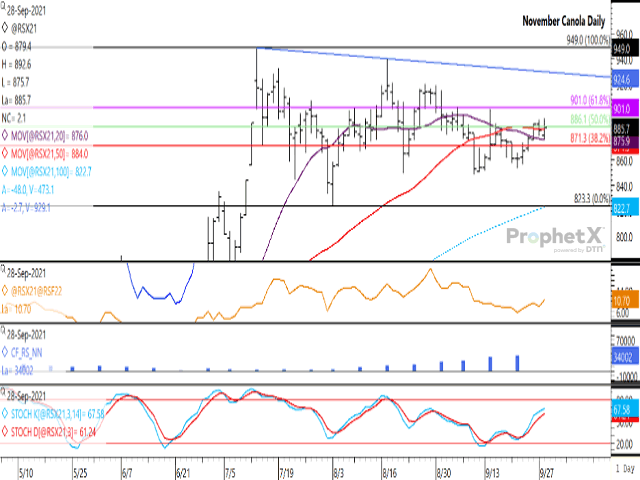
November canola closed higher for the fourth time in five sessions on Sept. 28, reaching the highest trade achieved in 10 sessions. The November settled $2.10/metric ton (mt) higher at $885.70/mt. Tuesday's trade found support at the contract's 20-day moving average (purple line), while also closing above the contract's 50-day moving average (red line) for a second time in three sessions. Tuesday's $16.90/mt trading range resulted in a move both lower and higher than Monday's trading range, while the higher close results in a bullish outside bar formed on the daily chart.
This week's trade is struggling with the $890/mt level, as well as the 50% retracement of the move from the contract's July high to August low, calculated at $886.10/mt (horizontal green line). A breach of this resistance could lead to a further move to the 61.8% retracement level of $901/mt, while psychological resistance at $900/mt may be a challenge in itself.
The brown line on the first study represents the Nov/Jan futures spread, which remains in bullish inverted territory and this inverse is seen strengthening. After reaching a low of $5.70/mt on Sept. 21 (Nov closing over the Jan contract) Tuesday's close was at $10.70/mt, the largest inverse seen since Sept. 9.
P[L1] D[0x0] M[300x250] OOP[F] ADUNIT[] T[]
The blue bars of the histogram in the second study show the noncommercial net-long position growing in each of the past weeks as of the most recent date for Sept. 21. The bullish net-long position of 34,002 contracts is the largest bullish position seen since mid-February. It is interesting to note that the bullish noncommercial net-long position in soybeans has been pared in seven of the past eight weeks, while the noncommercial net-long position in soybean oil futures has fallen in each of the past four weeks.
Signals from both the commercial and noncommercial sides show a growing bullish view of this market. Tuesday's Dow Jones ICE Closing Review found in ProphetX quotes a trader indicating canola needs to stay "extraordinarily expensive and extraordinarily high" in order to ration tight supplies.
Agriculture and Agri-Food Canada's latest forecast shows stocks forecast to fall to 500,000 mt by July 31, 2022, representing 3.5% of use. According to USDA's Canadian data, this is the lowest stocks since 1997-98, while the lowest stocks-to-use ratio found in records going back to 1964-65.
The challenge is to determine what price will be needed to achieve the market's goal.
Cliff Jamieson can be reached at cliff.jamieson@dtn.com
Follow him on Twitter @Cliff Jamieson
(c) Copyright 2021 DTN, LLC. All rights reserved.


Comments
To comment, please Log In or Join our Community .