

Canada Markets
The Canadian Dollar Faces Long-Term Technical Resistance
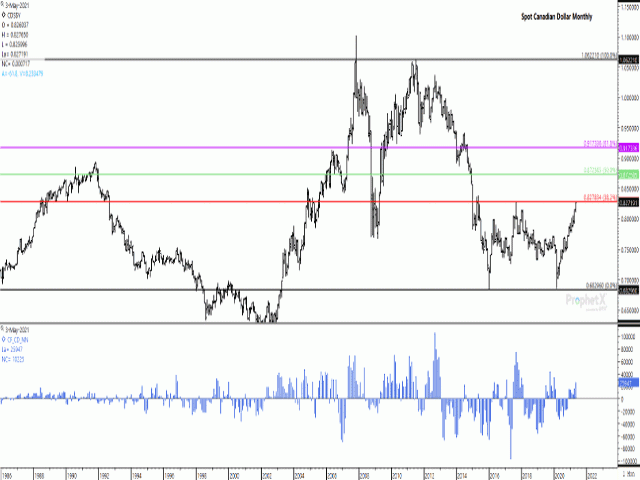
The spot Canadian dollar gained a modest 7 basis points on May 11 to close at $.827164 CAD/USD, while failing to move above the May 10 high of $.827650 CAD/USD. This marks the fifth consecutive higher close, with surging global commodity prices supportive the move.
This week's high marks the loonie's strongest trade against the USD since May 2015, when the Canadian dollar reached a high of $.838380 CAD/USD. This move came within 2 basis points of testing resistance at $.827834 CAD/USD, as shown by the horizontal red line on the monthly chart, which is the 38.2% Fibonacci retracement of the move from the July 2011 high of $1.062210 CAD/USD to the January 2016 low of $.682960 CAD/USD.
P[L1] D[0x0] M[300x250] OOP[F] ADUNIT[] T[]
As seen on the attached chart, this is the second time that this exchange has retraced to this level of resistance, after falling just short of a test of this resistance in September 2017.
From a technical perspective, the Canadian dollar exchange with the USD has reached a crossroads. A breach of the horizontal red line, at $.827834 CAD/USD, could lead to a continued move to the 50% retracement level at $.872585 CAD/USD, or to levels last seen December 2014.
Should the exchange fail at this resistance, this would lead to a double-top created within the channel that has largely bound trade since January 2015, close to a 14.5-cent spread ranging from a low of $.682960 CAD/USD to the high of $.827650 CAD/USD reached this week.
While not shown, weekly CFTC data shows investors have increased their bullish net-long position in the Canadian dollar for a third straight week and to the highest level seen since January 2020. The blue bars of the histogram on the lower study shows this monthly data, indicating the current net long of 25,947 contracts, remains well below highs reached in 2011, 2012, 2013, 2016, 2017, 2019 and 2020, or seven of the past 10 years.
Cliff Jamieson can be reached at cliff.jamieson@dtn.com
Follow him on Twitter @Cliff Jamieson
(c) Copyright 2021 DTN, LLC. All rights reserved.

Comments
To comment, please Log In or Join our Community .