
Canada Markets
Industry Watchdog Wary About Railway Performance
For many months, Canada's two railways have reported record performance in terms of grain moved, which includes a number of monthly records, quarterly records, and a crop year record for 2019-20. The railways have spent a great deal of money to achieve efficiencies and have worked hard to achieve these milestones, but Mark Hemmes of Quorum Corporation told RealAg Live, "it's a double-edged sword" and "I don't think it's the whole story." Quorum Corporation is an agency tasked with monitoring all aspects of grain movement.
The first thing that comes to my mind is that railway's supply of cars this crop year has failed to meet demand for shipping. As of week 29, the AG Transport Coalition reports that 93% of the cars in demand have been supplied since Aug. 1, which represents 266,380 hopper cars of the 286,186 cars wanted for loading. This can be further broken down to show CN suppling 88.1% of the cars wanted, while CP has spotted 97.6% of the cars wanted.
Overall, this is better than the 90.7% of the cars spotted in the same period last crop year and the three-year average for this period of 92%, but unfilled demand of 19,788 hopper cars equates to close to 2 million metric tons of grain movement and is a significant volume.
P[L1] D[0x0] M[300x250] OOP[F] ADUNIT[] T[]
Hemmes also pointed to the exceptional winter conditions faced through the end of January that allowed railways to achieve favourable levels of performance, along with the idea that the pandemic limited overall rail movement, which allowed grain movement to increase.
Statistics Canada data for total metric tons of all commodities carried by Canadian railways in the August-through-December period of 2020, or the first five months of the 2020-21 crop year, shows volume falling by 2.3% from the same period in the previous crop year despite records set for grain movement.
Hemmes pointed out that the records set by the railroads have raised the benchmark for rail movement of grain and have shown us what the railways are capable of going. But, looking forward, the discussion must turn to whether the railways' actions are matching the growth in productivity realized on the Prairies in terms of production.
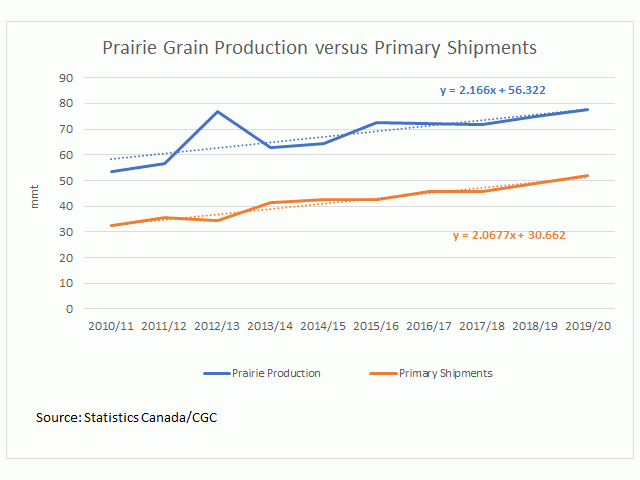
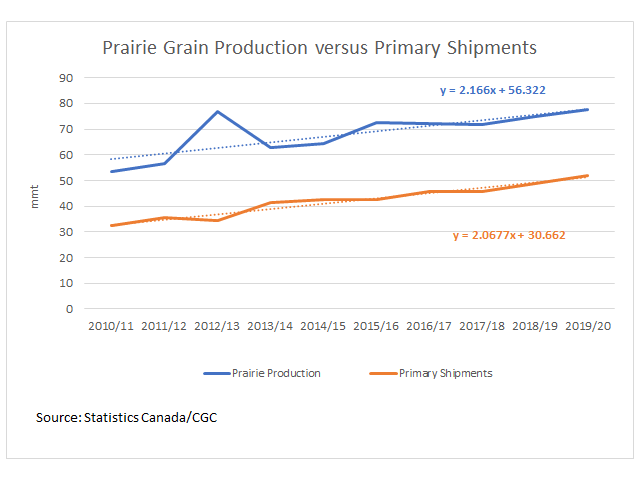
The attached chart shows the trend for the annual prairie production of principal field crops, as reported by Statistics Canada, along with the trend in primary elevator crop year shipments, as reported by the Canadian Grain Commission.
From the 2010-11 crop year to 2019-20, prairie production rose by 24.2 mmt, while shipping from primary elevators increased by 19.7 mmt. The average percent increase in production is calculated at 5.2%, while shipping has increased by an average of 4.6% over these 10 years. This difference is also noted in the linear trendline coefficient as shown on the Excel charts.
Cliff Jamieson can be reached at cliff.jamieson@dtn.com
Follow him on Twitter @Cliff Jamieson
(c) Copyright 2021 DTN, LLC. All rights reserved.
Comments
To comment, please Log In or Join our Community .