Canada Markets
Grain Shipper Data Leads to Growing Concerns
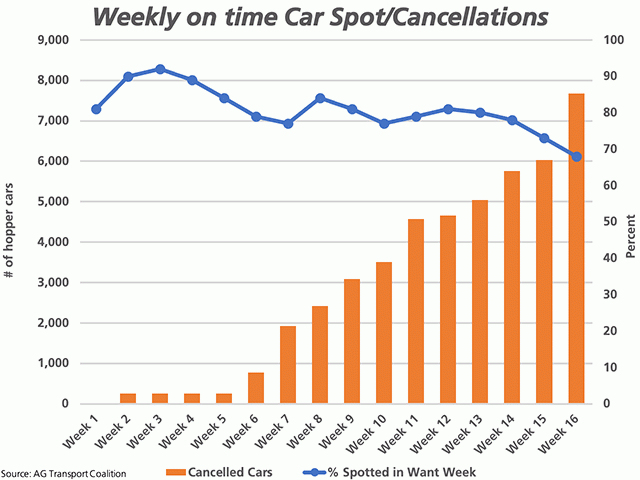
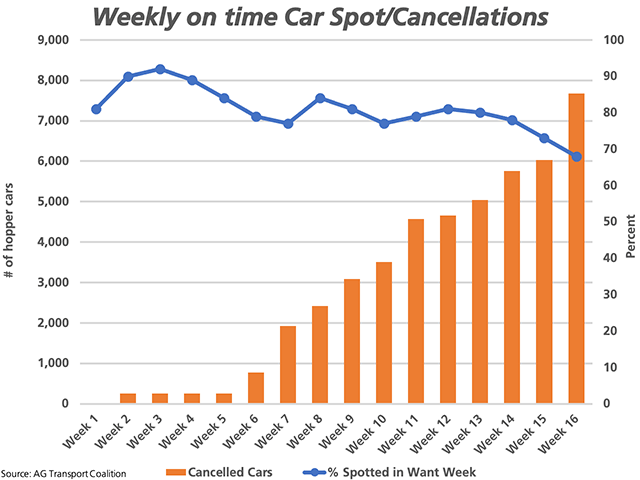
Following a string of positive news in the rail sector there is reason for concern, with the attached chart showing a couple examples where the trend is clearly not your friend.
With most of the concern seen on CN Rail track, we look to their most recent quarterly earnings released on Oct. 20 which pointed to seven consecutive monthly records set until the end of September, with the expectation that October movement would make it eight in a row. "Canadian grain continues to be a bright spot for CN, with our best third-quarter volume on record, beating the previous best in 2014 by 13%," as stated by CN Senior Vice President James Cairns to analysts and reported by the Canadian Press.
According to AG Transport Coalition data, a group that ships 90% of the prairie grain, demand for shipping has been hot during the first 16 weeks of the crop year. As of week 16, the coalition's members have requested 168,791 hopper cars for loading, a volume that is up 24.1% from the same week in 2019-20. This percentage has slipped for eight consecutive weeks, after reaching a high of 39.1% higher than the previous crop year, as of week 8, or the week ending Sept. 29. An early harvest and high-quality crop contributed to the early demand.
P[L1] D[0x0] M[300x250] OOP[F] ADUNIT[] T[]
While the demand has slipped on a year-over-year basis, so has the ability of the two railroads to spot the empty cars ordered for loading each week in the week wanted. This is represented by the blue line on the chart, reaching a high of 92% in week three, while has recently fallen for four consecutive weeks to 68%, with both railways combined. This data can be further broken down, with CN spotting 53% of the cars wanted for loading while CP spotted 82% of the cars wanted in week 16.
While CP Rail data was superior, data by marketing corridor shows only five of 80 CP cars destined for the U.S./Mexico were spotted for loading during week 16. CN data shows none of the 54 cars for the U.S./Mexico market were spotted and none of the 135 Vancouver Other/W. Canada shipping corridor cars were spotted. When the largest shipping corridors are considered, CN spotted 50% of the 2,791 Vancouver Bulk cars wanted, 47% of the 796 Thunder Bay cars and 60% of the 1,493 Prince Rupert cars during the week wanted for loading.
The brown bars represent the cars that are cancelled outright by the two railroads each week. Week 16 saw the largest week-over-week increase seen to-date of 1,649 cars to a total of 7,679 hopper cars. Of this number, 98.7% are due to CN cancellations. In order to compare with recent years, there was a total of 529 cars cancelled in the first 16 weeks of 2019-20 and 1,060 cars cancelled during the same period in 2018-19.
As of week 16, primary elevator stocks were reported at 4.1472 million metric tons, the lowest seen in 10 weeks. While this is down from the crop-year high reached of 4.782 mmt as of week 9, this volume is 12% higher than the three-year average for this week. Across the Prairies, this represents 79.4% of the estimated working capacity utilized by Quorum Corporation, ranging from 77.2% of working capacity in Alberta to 82.7% in Manitoba. Space overall across the system remains viewed as good.
Cliff Jamieson can be reached at cliff.jamieson@dtn.com
Follow him on Twitter @Cliff Jamieson
(c) Copyright 2020 DTN, LLC. All rights reserved.


Comments
To comment, please Log In or Join our Community .