Canada Markets
Railway Data Shows Movement off to a Favorable Early Start
According to Statistics Canada production estimates, Canada is on the way to a gigantic harvest, although there remains reason for some skepticism.
Statistics Canada's production data for the principal field crops points to total production of 98.039 million metric tons (mmt), up 3.6 million metric tons or 3.8% from 2019-20, which would be slightly larger than the record crop produced in 2013 of 97.947 mmt. Year-over-year data shows an increase in all-wheat production of 1.8 mmt, lentil production of 822,649 metric tons (mt), corn production of 625,300 mt, oat production of 275,600 mt and dry pea production of 123,500 mt, to name the largest changes.
While these numbers may warrant debate, Canadian Grain Commission data for the first five weeks of the 2020-21 crop year shows an aggressive start to the crop year. Producer deliveries of all principal field crops over the first five weeks, or the week ended Sept. 6, are up 34.5% year over year to 6.221 mmt while well above the five-year average of 4.810 mmt. Terminal receipts are up 33.4% to 5.432 mmt and above the five-year average of 3.877 mmt, and exports are up 14.6% to 4.326 mmt and 1 million metric tons higher than the five-year average of 3.3 mmt.
P[L1] D[0x0] M[300x250] OOP[F] ADUNIT[] T[]
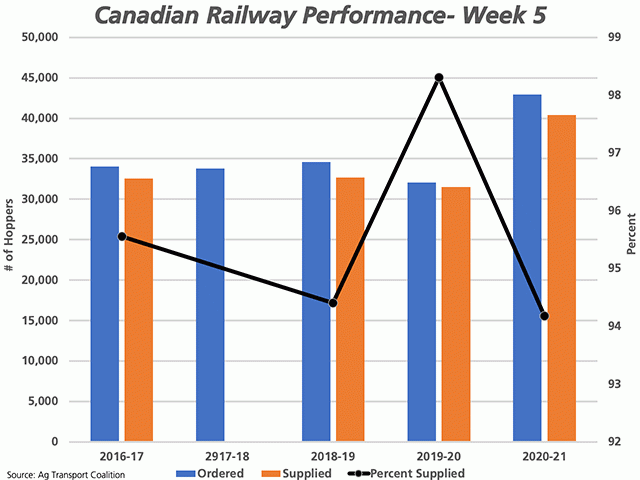
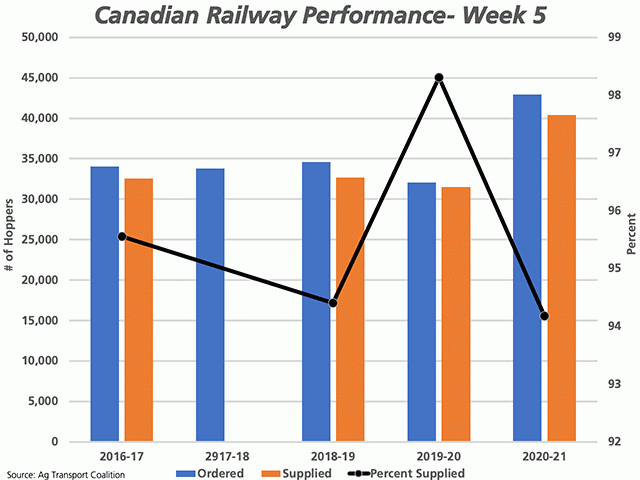
Railways have clearly responded, although the weekly data from the Ag Transport Coalition bears watching. Over the first five weeks of the crop year, the AG Transport Coalition reports that the largest grain companies that ship 90% of the prairie grain have ordered 42,909 hopper cars for loading, up 33.9% from last year and 27.6% higher than the four-year average. This comparison is shown by the blue bars on the attached chart.
Over this same period, railways have responded by supplying 40,411 cars, or 94.2% of the cars ordered as shown by the black line with markers, measured against the secondary vertical axis. While the cars supplied to-date are well above the 31,498 cars supplied in the same period of 2019-20 and the 32,651 cars supplied in the year prior, the percentage of the cars supplied as compared to cars ordered is the lowest seen over the period shown (note that week five data is not available for the 2017-18 crop year).
Over the past five weeks, CN Rail has increased the percentage of cars spotted for loading in the week wanted, supplying just 64% of the cars wanted in week one or early August, while reaching 85% as of week five. This compares to 99% for the same week in 2019-20. Over the same period, CP Rail spotted 99% of the hopper cars wanted for loading during week one, while falling 10 points from week four to week five to supply 83% of the cars wanted, which compares to 97% reported for the same week in 2019-20. Combined, the two railways spotted 84% of the cars wanted for week five during the week wanted.
As of week five, the number of outstanding orders has grown to 1,798 cars, the largest component of the unfulfilled shipper demand. This is split between CN at 640 cars and CP at 1,158 cars. Combined, this compares to just 120 outstanding orders reported for this week in 2019-20 and 918 for the same week in 2018-19.
As of the CGC's week five report, space in the country remained favorable despite the progressing harvest and growing number of outstanding orders. In total, there was 2.1 mmt in storage in licensed facilities, having fallen for a second week, while accounting for just 40.4% of estimated working capacity across the system. This ranges from a low of 29.4% of working capacity in Alberta, to 43.5% in Saskatchewan to 48.4% in Manitoba.
Cliff Jamieson can be reached at cliff.jamieson@dtn.com
Follow him on Twitter @Cliff Jamieson
© (c) Copyright 2020 DTN, LLC. All rights reserved.


Comments
To comment, please Log In or Join our Community .