Canada Markets
A Look at Pre-Report Estimates of Global Grain Stocks
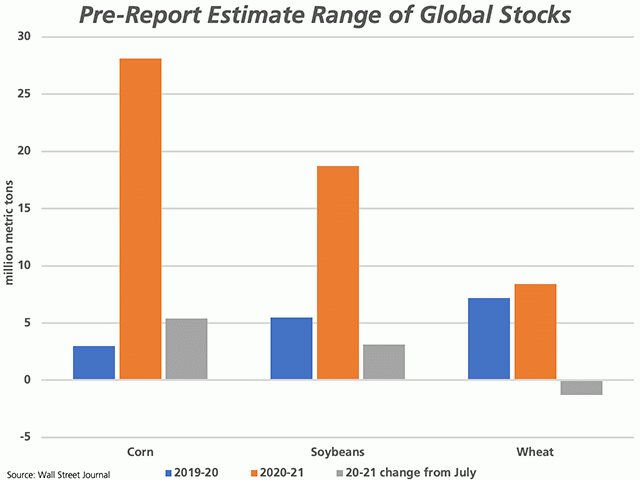
Ahead of the Aug. 12 USDA WASDE report, we look at the pre-report estimates of the USDA's global ending stocks estimates as they relate to: 1) Individual crops; and 2) The crop year. This can be viewed as a measure of the uncertainty that exists in the market in advance of the report, as well as an indication of the potential for a surprise.
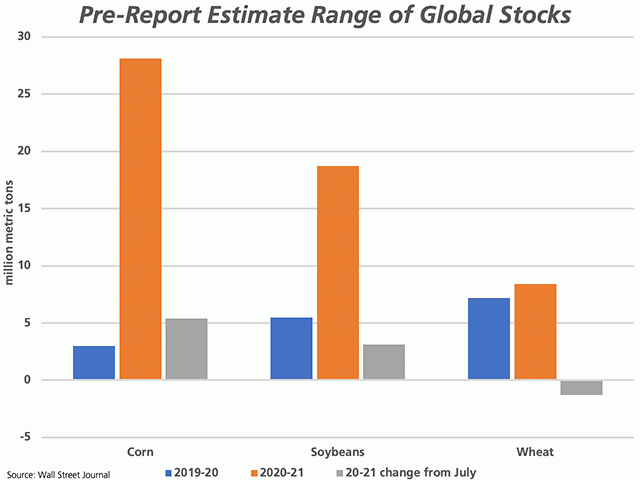
As expected, as the 2019-20 crop year ends, there is lesser degree of uncertainty seen in the responses in the Wall Street Journal's survey of industry participants on old-crop or 2019-20 stocks. The spread between the lowest estimate and the highest estimate of global corn stocks is reported at 3 million metric tons (mmt) (blue bars), 5.5 mmt for soybeans and a higher 7.2 mmt for wheat.
The degree of uncertainty grows as we move to the 2020-21 crop year, with South American crops yet to be planted. The range of estimates (brown bars) is now 28.1 mmt for corn, 18.7 mmt for soybeans and 8.4 mmt for wheat, which is consistent with the old-crop range. The degree of uncertainty also drops as we move from left to right across the chart, or from corn to soybeans to wheat.
P[L1] D[0x0] M[300x250] OOP[F] ADUNIT[] T[]
The grey bars represent the estimated change in ending stocks from the USDA's official July estimate to the average of the pre-report estimates for each crop ahead of the August report. Based on the average of estimates, a bearish report is forecast for row crops, with an expected 5.4 mmt increase in global corn stocks expected, along with a 3.1 mmt increase in soybean stocks.
The average of pre-report estimates is perhaps surprising for wheat, with the average of pre-report estimates indicating a month-over-month drop of 1.3 mmt to 313.5 mmt, still a record carryout. This comes as we see reports of higher revisions for Russia, recent rainfall in Australia contributing to that country's recovery in production, while data released from a private crop tour in Canada pointed to the potential for a record-sized wheat harvest, based on July field inspections.
DTN 360 Poll
This week's poll looks at the readers' comfort level with the various crop condition assessments released by government for their particular area. You can weigh in with your thoughts in this poll which is found at the lower right of your DTN Home Page.
Cliff Jamieson can be reached at cliff.jamieson@dtn.com
Follow him on Twitter @Cliff Jamieson
© (c) Copyright 2020 DTN, LLC. All rights reserved.


Comments
To comment, please Log In or Join our Community .